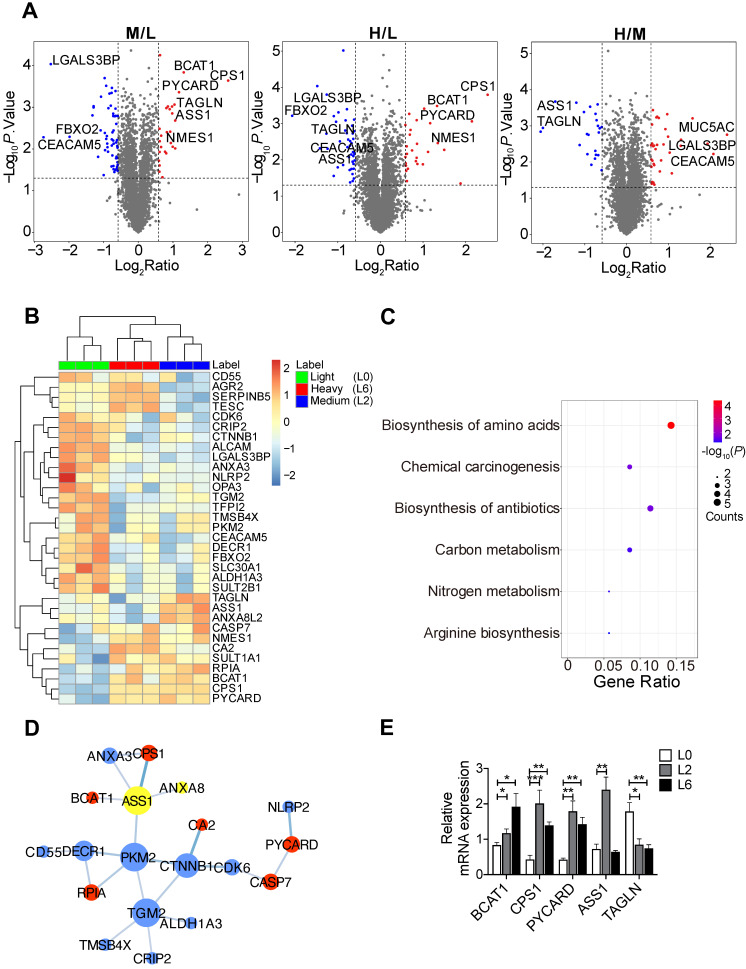
Figure 1.
SILAC-based quantitative proteomic analysis of primary and metastatic A549 cells. (A) Volcano plots of SILAC ratios between two groups. Red and blue dots indicate significantly increased and decreased proteins, respectively. FC > 1.5 or FC < 0.67, P < 0.05. (B) Heatmap of significantly changed proteins in both L2 and L6 cells. Log2 proteins intensities were scaled and clustered using hierarchical clustering. (C) KEGG pathway analysis of proteins changed in both L2 and L6 cells. (D) Protein-protein interaction network of significantly changed proteins in L2 and L6 cells. Red and blue represent increase and decrease in both L2 and L6, yellow represents proteins with opposite direction of change. (E) Real-time PCR analysis of mRNAs of a subset significantly changed proteins. Student's t-test, *P < 0.05, ** P < 0.01, *** P < 0.001, n = 4.

