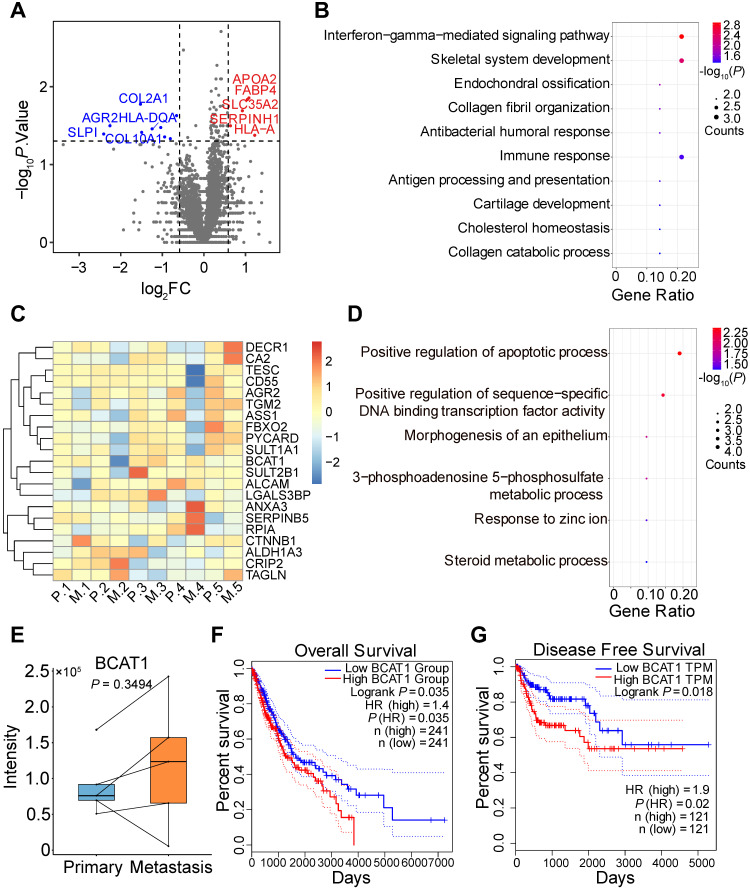
Figure 2.
TMT-based quantitative proteomic analysis of primary and metastatic human tumor tissues. (A) Volcano plot of TMT-based quantitative proteomic results of tumor tissues from lung cancer patient tumor specimens. Tissues from primary and metastatic lung cancer of the same patient were paired. (B) Gene ontology analysis of the 14 significantly changed proteins from TMT proteomic analysis. (C) Heatmap of tissue protein expression profile of 21 proteins significantly changed in SILAC proteomics. (D) Gene ontology analysis of (C). (E) BCAT1 protein expression in primary and metastasis tissues samples from lung cancer patients (Paired student's t-test, n = 5). (F) Kaplan-Meier OS curve of LUAD and LUSC patients stratified by BCAT1 expression from the TCGA datasets. (G) Kaplan-Meier DFS curve generated from the LUSC dataset.

