Figure 3.
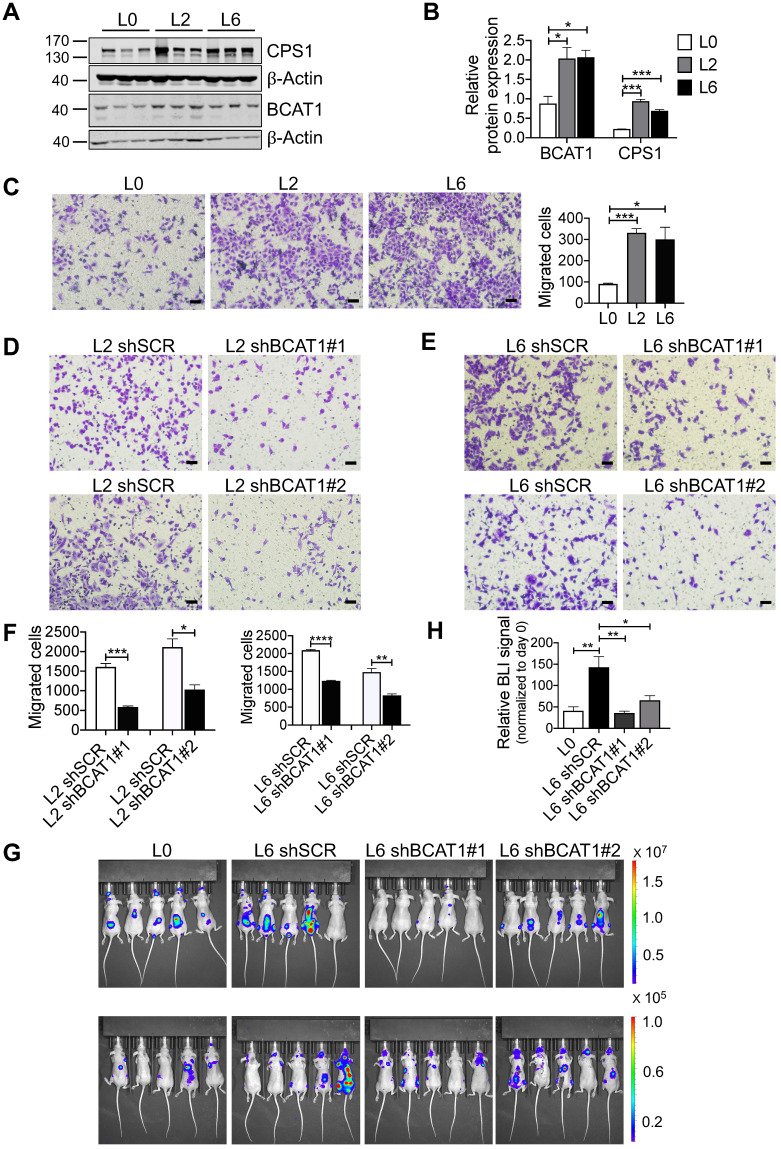
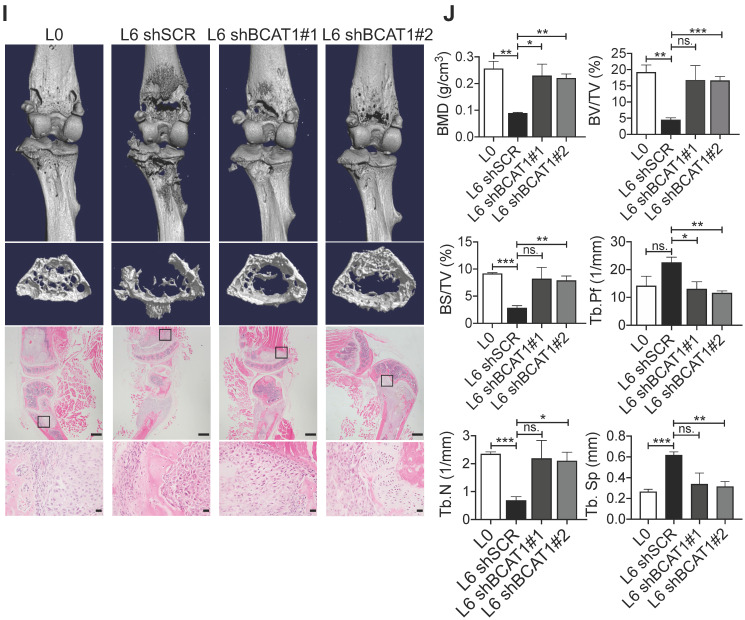
High expression of BCAT1 promotes cancer cell migration and metastasis. (A) Western blot analysis of BCAT1 and CPS1 expression in primary and metastatic A549 cells. (B) Statistical analysis of the Western blot results in (A) (Student's t-test, *P < 0.05, ** P < 0.01, *** P < 0.001, n = 3). (C) Representative images (36 h after seeding) and bar graph of associated group data from trans-well studies of L2 and L6 cell migration (magnification: 200 ×, scale bar: 50 μm, n = 3). (D, E) Images from trans-well assays showing decreased migration of L2 and L6 cells with stable knockdown of BCAT1 (magnification: 200 ×, scale bar: 50 μm). (F) Bar graphs of group data from trans-well studies of the effect of BCAT1 knockdown on L2 and L6 cell migration. *P < 0.05, ***P < 0.001, n = 3. (G) Representative IVIS images of tumor growth and metastasis. (H) Bar graph showing the relative bioluminescence intensity (BLI) of 4 groups; the data were analyzed using Kolmogorov-Smirnov test since the data was not normally distributed. * P < 0.05, n = 10. To exclude the difference of luciferase intensities in day 0 injection, we normalized BLI signals to respective signals in day 0. (I) Representative mCT images of femurs from the mice showing the proximal femur and trabecular bone of the femur metaphysis, as well as H&E staining for tumor site of origin (magnification: 20 ×, scale bar: 500 μm, and 400 ×, scale bar: 20 μm). (J) Bar graph of quantitative mCT analysis of trabecular bone parameters of femurs from the mice. BMD, bone mineral density; BV/TV, percent bone volume; BS/TV, bone surface density; Tb. N, trabecular number; Tb. Sp, trabecular separation; Tb. Pf, trabecular pattern surface.


