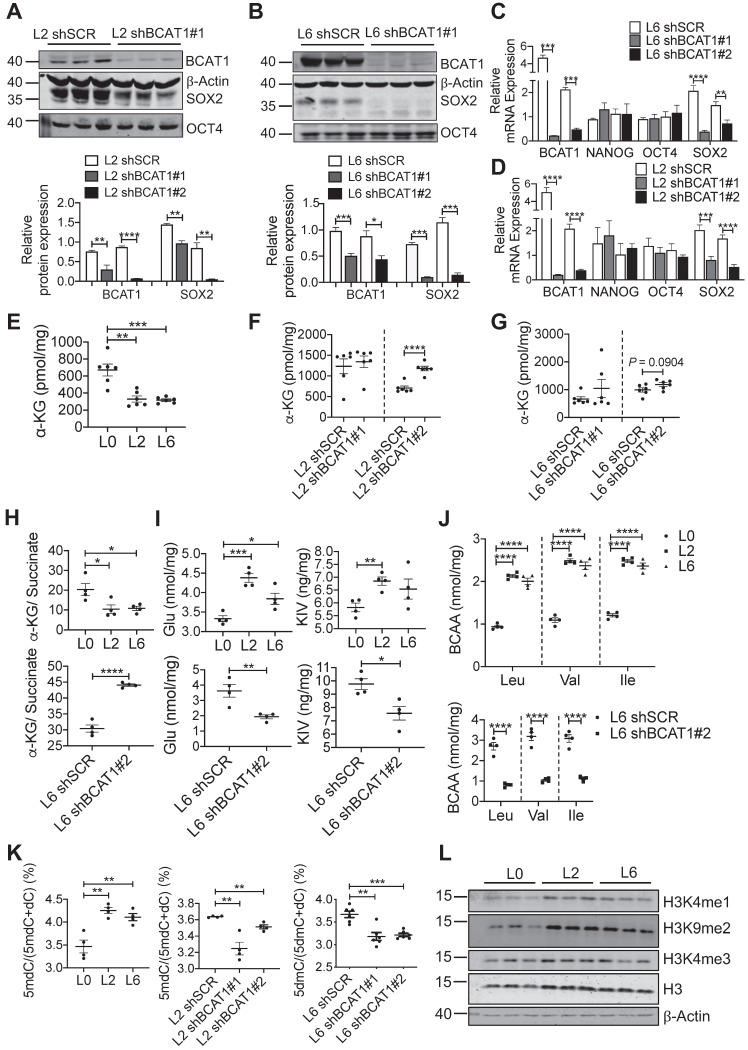
Figure 5.
Reducing SOX2 expression by modulating BCAT1 levels. (A, B) Western blots and associated bar graphs showing reduced expression of SOX2 after knocking down BCAT1 (Student's t-test, * P < 0.05, n = 3). (C, D) Bar graphs showing the effect of BCAT1 knockdown on SOX2 transcription in L2 and L6 cells (n = 4~8). (E, F and G) Quantification of α-KG in A549 cells with or without BCAT1 knockdown, n = 6. (H) α-KG-to-succinate ratio, calculated using the measured concentrations from (E and G) and Figure S7A-B. (I) Quantification of glutmate and KIC in A549 cells, n = 4. (J) Quantification of BCAA in A549 cells, n = 4. (K) Quantification of 5-methyl-deoxycytosine (5mdC) and deoxycytosine (dC) in A549 cells, n = 4~6. (L) Western blot analysis of histone methylation in L0, L2 and L6 cells.

