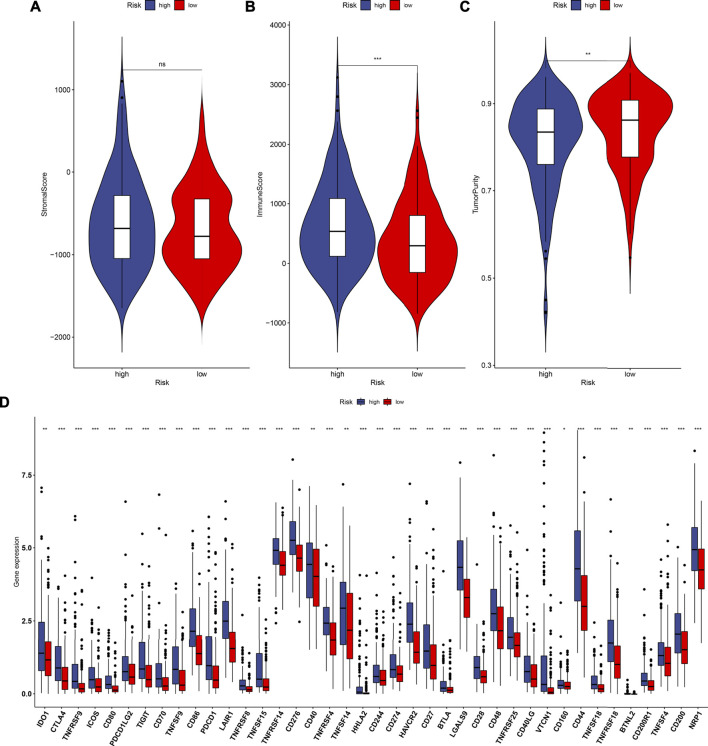
FIGURE 6.
Estimation of the associations between the TLR-based signature and TME of HCC in the TCGA cohort. (A–C) Comparisons of stromal score, immune score, and tumor purity between high and low TLR-based RS groups using the ESTIMATE method. (D) Comparisons of immune checkpoints between high and low TLR-based RS groups. p values were estimated with Wilcoxon rank-sum tests. *p < 0.05; **p < 0.01; ***p < 0.001; ns: not significant.

