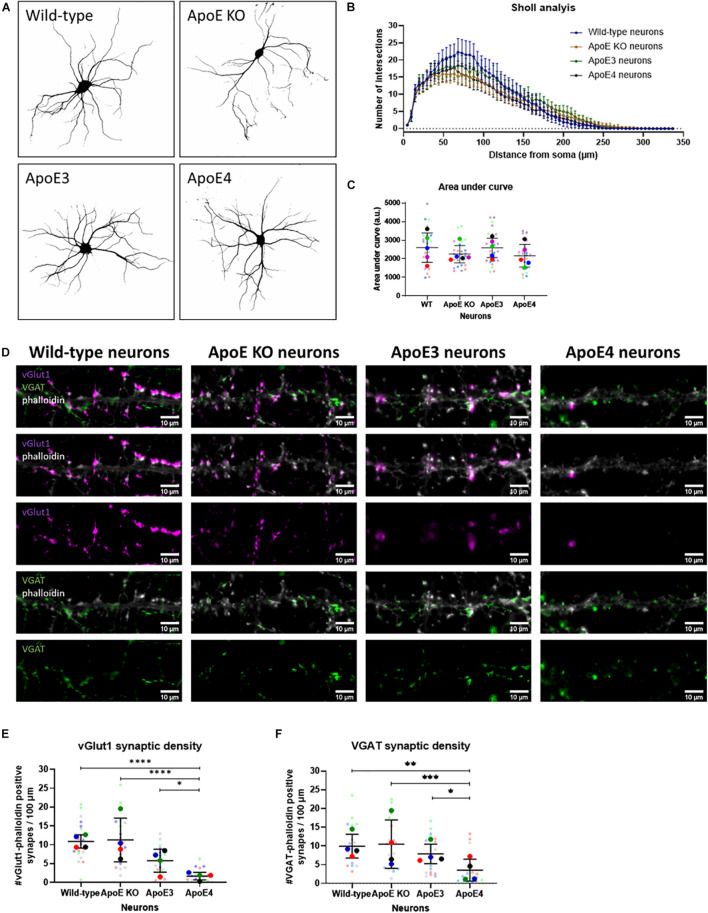
FIGURE 5.
Neuronal ApoE4 reduces synaptic density, but not dendritic branching. (A) Representative binary images obtained by epifluorescence microscopy of wild-type, ApoE KO, ApoE3 and ApoE4 primary neurons (19 DIV). Neurons were labeled for neuronal/dendritic marker MAP2. (B) Graph showing Sholl analysis results of wild-type, ApoE KO, ApoE3 and ApoE4 neurons (N = 5 embryos per conditions, n = 25 neurons per condition). Data are shown as mean ± 95% CI. (C) Quantification of area under the curve of Sholl analysis data shown in panel (B) of wild-type, ApoE KO, ApoE3 and ApoE4 neurons (N = 5 embryos per condition, n = 25 neurons per condition). Statistical analysis was performed using one-way ANOVA. Data are shown in a superplot including mean ± SD of each condition. (D) Representative microscopy images of excitatory vGlut1-positive (magenta) and inhibitory VGAT-positive (green) presynapses in phalloidin-labeled (gray) neurons in wild-type, ApoE KO, ApoE3 and ApoE4 neurons (19 DIV). Scale bar represents 10 μm. (E,F) Quantification of vGlut1-phalloidin synaptic density (E) and VGAT-phalloidin synaptic density (F) in wild-type, ApoE KO, ApoE3 and ApoE4 neurons (N = 4 embryos per condition, n = 20 neurons per condition). Superplots represent all data points of each analyzed embryo and neuron. Data are shown as mean ± SD. Kruskall Wallis tests in combination with Dunn’s test were used to analyze statistical differences. *p < 0.05; **p < 0.01; ***p < 0.001; ****p < 0.0001.

