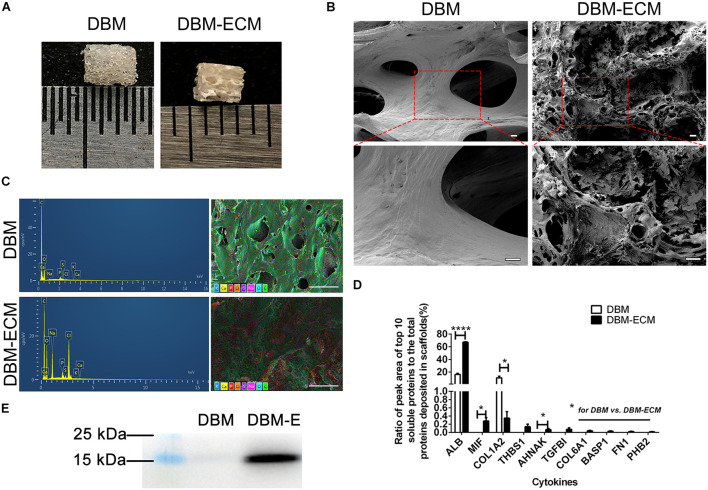
FIGURE 2.
Evaluation of the surface modification of DBM scaffolds with hucMSC-ECM. (A) The gross appearance of the DBM scaffold with or without surface modification. (B) Scanning electron microscopy (SEM) images of scaffolds. (C) Energy dispersive spectroscopy (EDS) of scaffolds. (D) HPLC-MS/MS high-throughput analysis for the top 10 principal soluble protein components highly deposited in the DBM-ECM. (E) Protein expression of MIF tested by Western blot. Scale bar for the top panel of (B): 100 μm, Scale bar for the down panel of (B): 50 μm; Scale bar for (C): 500 μm; *p < 0.05, ****p < 0.001.

