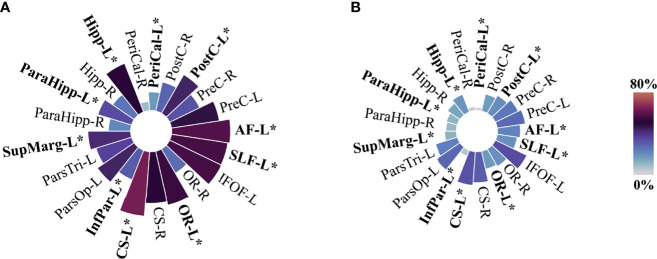
Figure 5.
Circular bar plots by choice of primary surgical strategy. (A) Only biopsy N=55. (B) Tumor resection N=222. PreC, Precentral; PostC, Postcentral; PeriCal, Pericalcarine; Hipp, Hippocampus; ParaHipp, Para hippocampus; SupMarg, Supramarginal; ParsTri, Pars Triangularis; ParsOp, Pars Opercularis; InfPar, Inferior parietal; CS, Corticospinal; OR, Optic radiations; IFOF, Inferior fronto-occipital fasciculus; SLF, Perisylvian anterior, posterior, and long components of the superior longitudinal fasciculus; AF, Arcuate fasciculus. “L” and “R” indicate left and right sides. Size and color intensity represent the percentage of tumors in the proximity to predefined eloquent regions by group. Fisher’s exact test was used for two-group comparison between only biopsied and resected tumors. *P value equal or inferior to 0.002.

