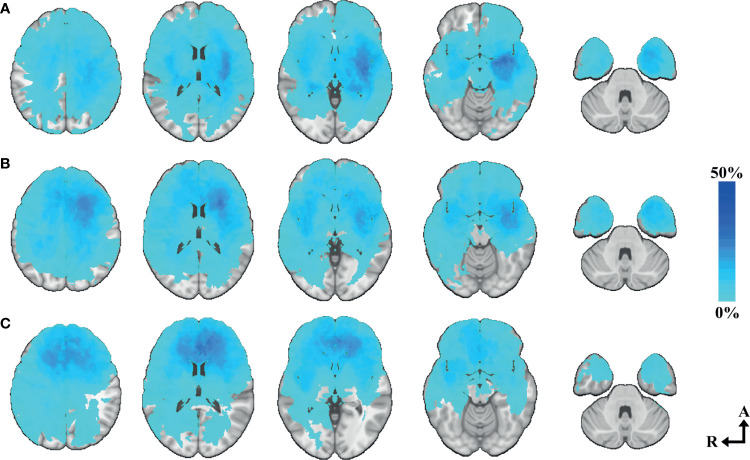
Figure 6.
Tumor heatmaps of molecular subgroups according to WHO 2016. (A) IDH wild-type astrocytomas heatmap N=82—axial slices number 33, 15, 0, -15, -33. (B) IDH-mutated astrocytomas heatmap N=67—axial slices number 33, 15, 0, -15, -33. (C) Oligodendrogliomas N=73—axial slices number 33, 15, 0, -15, -33. Axial coordinates in MNI space. The color intensity represents the voxel-based percentual distribution of each group.

