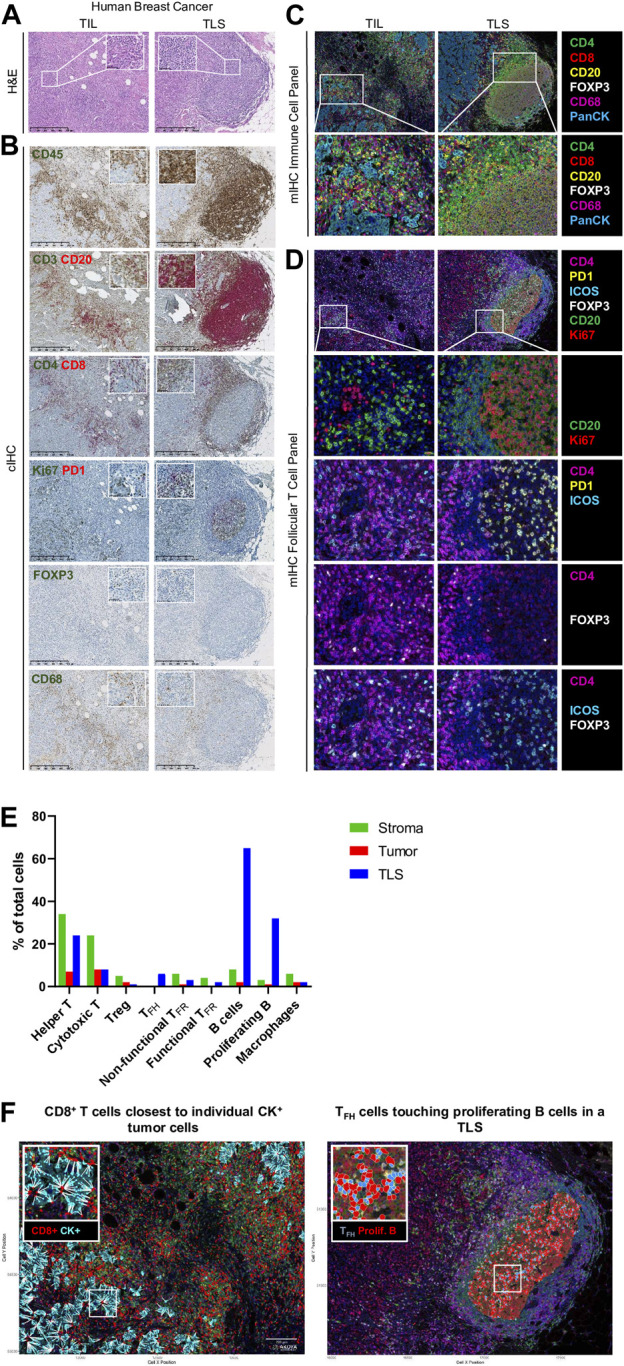
FIGURE 2.

Immune profiling of breast cancer. (A–D) Representative images of tumor-infiltrating lymphocyte (TIL) and tertiary lymphoid structure (TLS) in FFPE breast cancer sections detected by (A) hematoxylin and eosin staining (H&E), (B) chromogenic IHC (cIHC), and (C, D) multiplex IHC (mIHC). (E) Quantification of immune cells in stromal, tumoral, and TLS areas using InForm and PhenoptrReports. (F) Spatial distribution of immune cells including CD8+ T cells closest to individual CK+ tumor cells and TFH cells touching proliferating B cells in a TLS. H&E and cIHC slides were scanned at ×40 magnification and the images are displayed at ×5 and ×40 magnification. mIHC slides were scanned at ×20 magnification.
