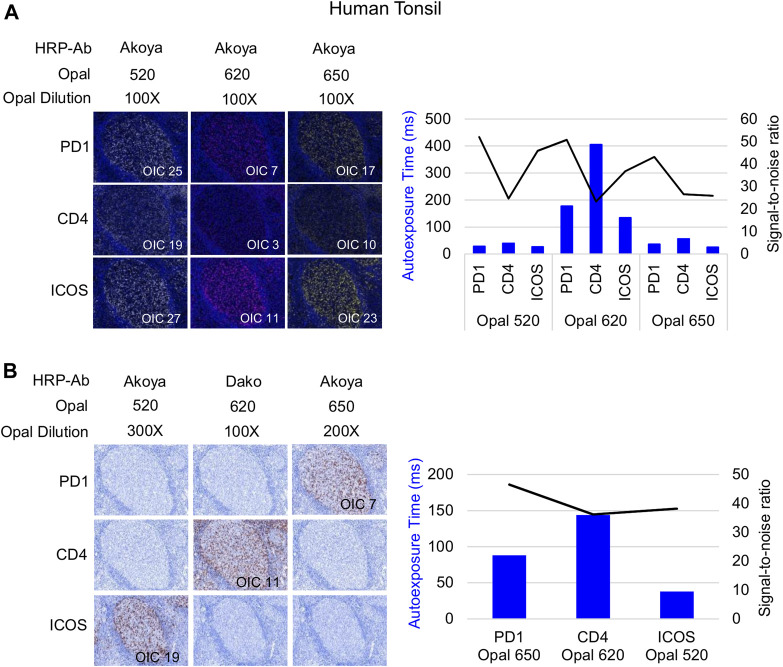
FIGURE 3.
Antibody-Opal pairing and signal balance of three markers co-localized on the cell surface. (A) Composite images of consecutive monoplex FFPE tonsil sections stained with PD-1, CD4, or ICOS with Opal 520, 620, or 650. The graph shows the autoexposure times (blue bars) and the signal-to-noise ratio (black curve) for each pairing. The signal-to-noise ratio was calculated via dividing the Opal intensity count (OIC) by the Opal background obtained in InForm. (B) Simulated DAB IHC images of optimized monoplex staining in (A). The graphic shows the autoexposure times (blue bars) and the signal-to-noise ratio (black curve) of optimized monoplex staining determined by InForm. The slides were scanned at ×20 magnification with the Vectra Polaris and the composite images were analyzed with InForm software (v.2.4.8) and PhenoptrReports (Kent S Johnson (2020). phenoptr: inForm Helper Functions. R package v.0.2.6. https://akoyabio.github.io/phenoptr/).

