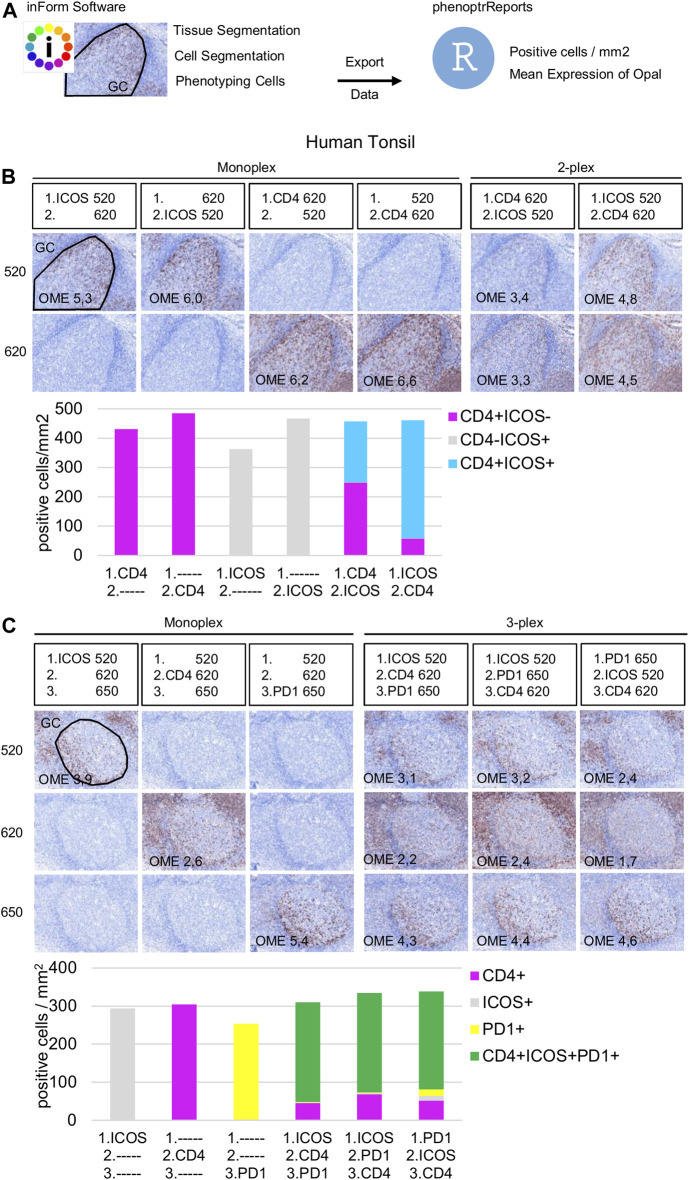
FIGURE 4.
Staining order optimization of three markers co-localized on the cell surface. (A) Workflow used to segment tissue regions, segment cells, and phenotype cells with the InForm software before quantifying cell density (positive cells/mm2) and Opal mean expression (OME) using PhenoptrReports on a germinal center (black line). (B) Simulated DAB IHC images of monoplex and 2-plex slides staining of consecutive FFPE tonsil sections alternating the position of CD4 and ICOS. The cell densities of CD4+ICOS− (magenta), CD4−ICOS+ (grey), and CD4+ICOS+ (cyan) were quantified in the monoplex and 2-plex slides. (C) Simulated DAB IHC images of monoplex and 3-plex slides stained on consecutive FFPE tonsil sections, including PD-1 in first, second, or third position in the ICOS > CD4 staining order. The cell densities of total CD4+ (magenta), total ICOS+ (grey), total PD1+ (yellow), and CD4+ICOS+PD-1+ (green) were quantified in the monoplex and 3-plex slides. The slides were scanned at ×20 magnification with the Vectra Polaris and the composite images were analyzed with InForm software (v.2.4.8) and PhenoptrReports (Kent S Johnson (2020). phenoptr: inForm Helper Functions. R package v.0.2.6. https://akoyabio.github.io/phenoptr/).

