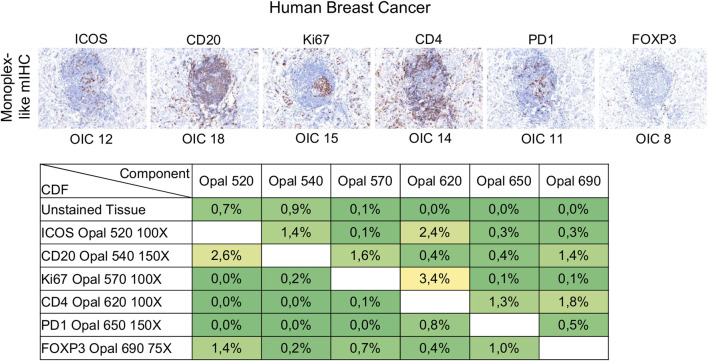
FIGURE 5.
Evaluation of signal balance and crosstalk interference. Simulated DAB IHC images of monoplex stained slides of FFPE breast cancer sections to look like an mIHC slide by replacing the other primary antibodies with diluent. The unmixing quality report table shows the crosstalk from non-signal Opals for each component. The crosstalk values for a component are acceptable for phenotype classification and expression level assessment if all percentages in the component’s column are <5%. The slides were scanned at ×20 magnification with the Vectra Polaris and the composite images were analyzed with InForm software (v.2.4.8) and PhenoptrReports (Kent S Johnson (2020). phenoptr: inForm Helper Functions. R package v.0.2.6. https://akoyabio.github.io/phenoptr/).

