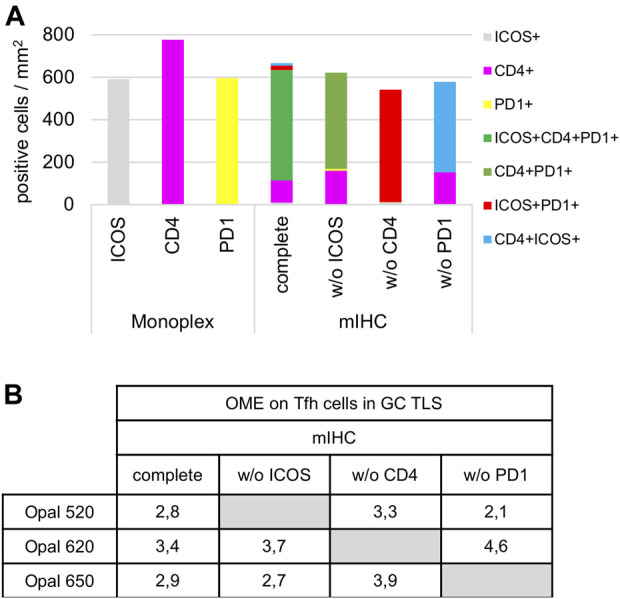
FIGURE 7.

Cell density and Opal expression quantification of drop control slides. (A) Cell density quantification of CD4+, ICOS+, PD-1+, and TFH subpopulations (ICOS+CD4+PD-1+, CD4+PD-1+, ICOS+PD-1+, CD4+ICOS+) on monoplex slides, the mIHC slide and drop control slides without (w/o) ICOS, CD4, or PD-1. Each condition was quantified following the workflow shown in Figure 4A in a TLS GC (black dotted line in Figure 6). (B) Quantification of 520, 620, and 650 Opal mean expression (OME) on TFH cells from an mIHC slide and drop control slides without (w/o) ICOS, CD4, PD-1 staining. Each condition was quantified followed the workflow as described above. The slides were scanned at ×20 magnification with the Vectra Polaris and the composite images were analyzed with InForm software (v.2.4.8).
