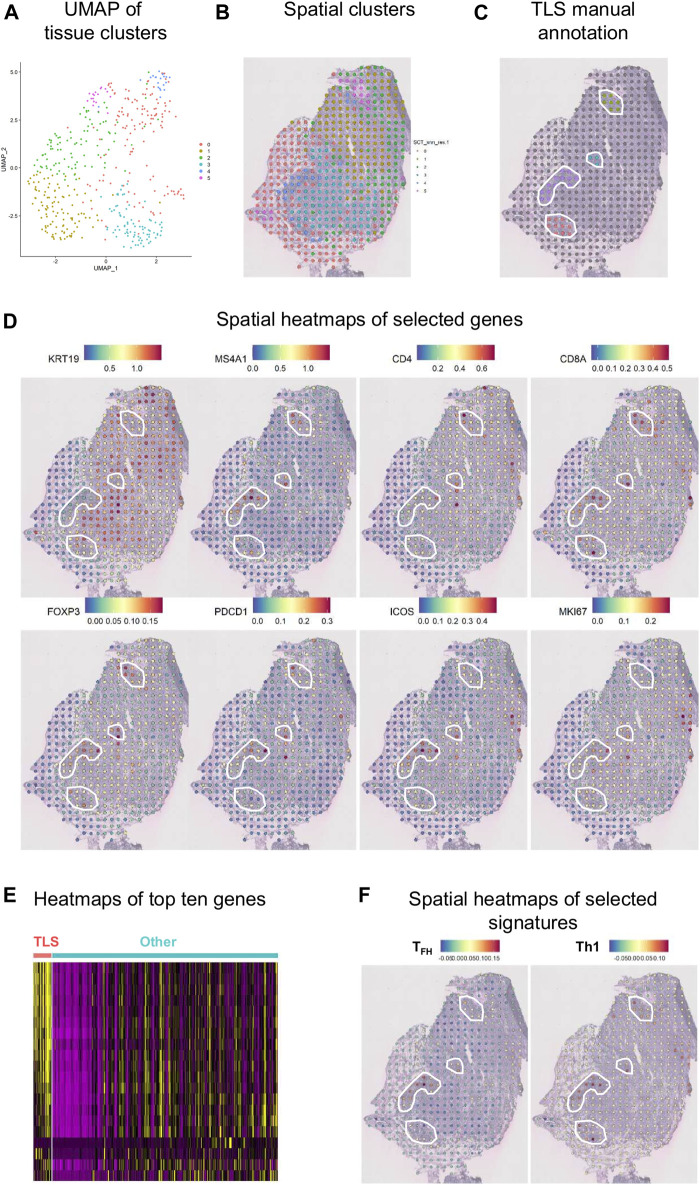
FIGURE 8.
Spatial gene expression in breast cancer. (A) UMAP representation of global gene expression in individual spots from a fresh-frozen section of an invasive lobular carcinoma created five distinct clusters with unbiased Seurat clustering. (B) The features were placed back onto the H&E staining. (C) Four TLS were histologically annotated on brightfield images of H&E-stained tissue sections (white line). (D) Visualization of eight selected genes as spatial heatmaps. (E) A heatmap of the top ten differentially expressed genes in the annotated TLS compared with the remaining tumor tissue. (F) Spatial heatmaps of TFH and Th1 signatures.

