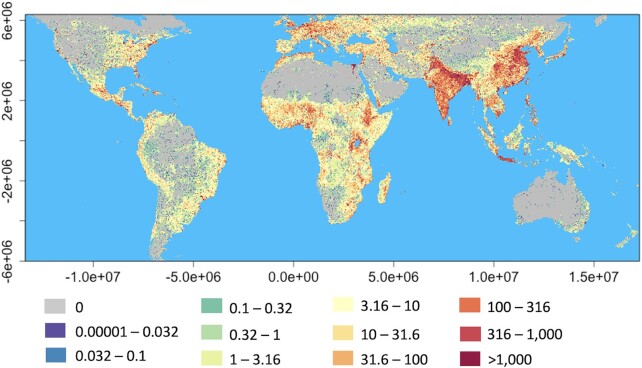
Fig. 2.
Spatial variation in human population density. The layer was created by adjusting the raw LandScan 2016 population count layer for area and projecting to Behrmann equal area (EASE-Grid 2.0: EPSG:6933; Brodzik et al. 2012) to give population density per km2 at a resolution of 1.61 × 2.12 km2. The color banding is log10 at intervals of 0.25.

