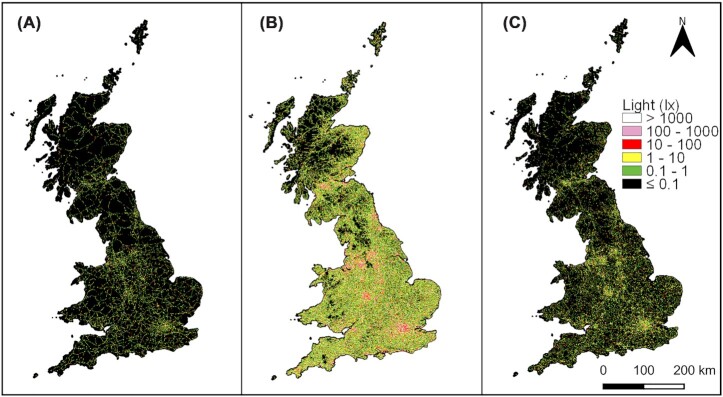
Fig. 3.
Estimated variation across Great Britain in ALAN from (A) streetlights and (B) vehicle headlights in terms of maximum exposure, that is, light level when a vehicle passes, and (C) average exposure, accounting for traffic volumes (based on Phillips et al. 2021). Maps (A) and (C) are modeled using a simple inverse square decay function (ignoring topography), with respect to distance from roads, and varied event frequency based on the type of roads.

