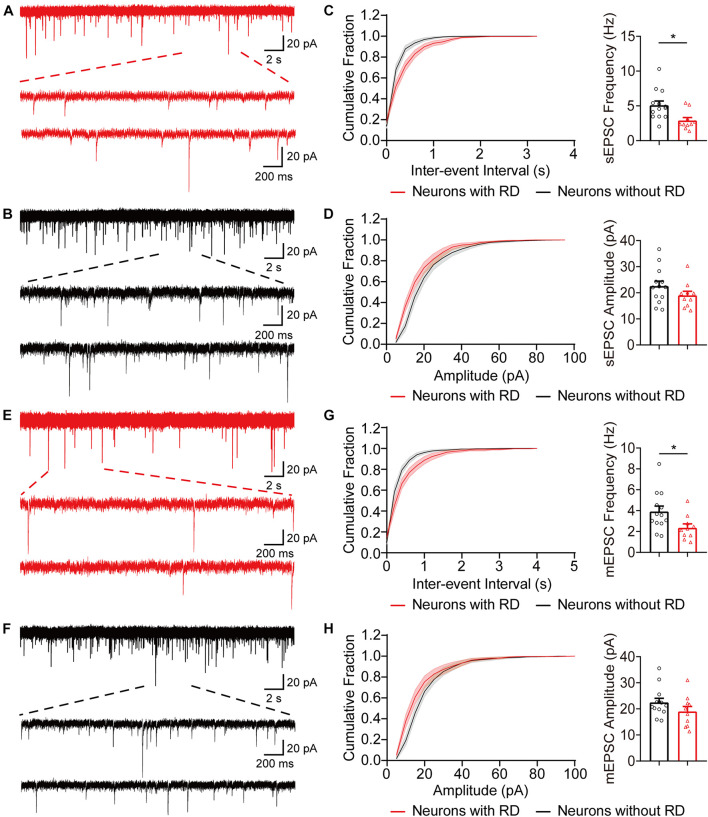
FIGURE 4.
Excitatory synaptic inputs differ in SG neurons with or without RD. (A,B) Exemplar traces of sEPSCs in SG neurons expressing (A) or lacking (B) RD. The bottom panels show the proportional enlargements corresponding to the upper traces. (C,D) Cumulative probability and summary bar graphs of the inter-event interval (C) as well as the amplitude (D) showing a lower frequency of sEPSCs in neurons with RD. (E,F) Typical traces of mEPSCs in RD-expressing (E) or RD-lacking (F) SG neurons. (G,H) Summarized data showing that RD-expressing neurons had a lower mEPSCs frequency compared to those lacking RD (G), while mean amplitudes of mEPSCs from the two populations were comparable (H). sEPSC, spontaneous excitatory postsynaptic current; mEPSC, miniature excitatory postsynaptic current. *p < 0.05.

