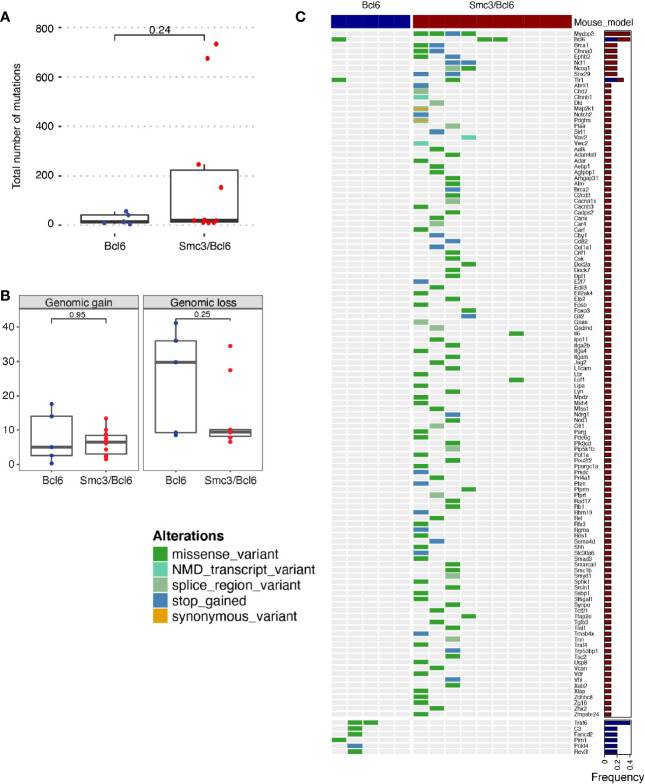
Figure 5.
Mutational analysis of Smc3/Bcl6 tumors. (A, B) Mutational burden of Bcl6 and Smc3/Bcl6 tumors assessed by exon capture analysis. (A) number of mutations per tumor. (B) Genomic gain and loss in Bcl6 and Smc3/Bcl6 tumors. (C) Oncoprint depicting AID-induced mutations in 125 non-immunoglobulin genes in Bcl6 (n=5) and Smc3/Bcl6 (n=10) tumors. Mutation frequency is shown in the right bar plot for Bcl6 (blue) and Smc3/Bcl6 (red). Mutations were classified as missense mutations, nonsense-mediated decay transcript variants, splice regions variants, stop gained, or synonymous variants, as indicated by the color key on the left of the oncoprint.

