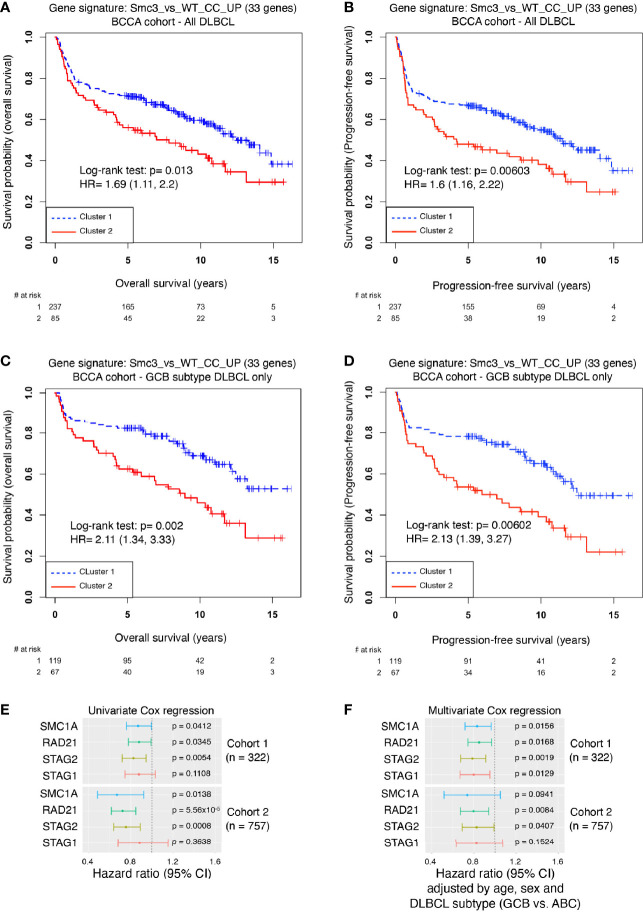
Figure 6.
Decreased cohesin levels predict poor survival in DLBCL patients. (A) Kaplan-Meier overall survival curves for DLBCL patients (n=322) in BCCA cohort clustered with the Smc3 haploinsufficient gene signature (6). (B) Kaplan-Meier progression-free survival curves for DLBCL patients (n=322) in BCCA cohort clustered with the Smc3 haploinsufficient gene signature (6). (C) Kaplan-Meier overall survival curves for GCB-subtype DLBCL patients (n=186) in cluster 1 and 2. (D) Kaplan-Meier progression-free survival curves for GCB-subtype DLBCL patients (n=186) in cluster 1 and 2. (E) Univariate Cox regression analysis, and (F) multivariate Cox regression analysis were performed in two cohorts of DLBCL patients (cohort 1, n = 322 individuals; cohort 2, n = 757 individuals). In both cases, SMC1A, RAD21, STAG2 and STAG1 expression levels were used as a continuous variable. Multivariate analysis was adjusted by age, sex and DLBCL subtype of the individual. Error bars represent 95% confidence intervals of the hazard ratio.

