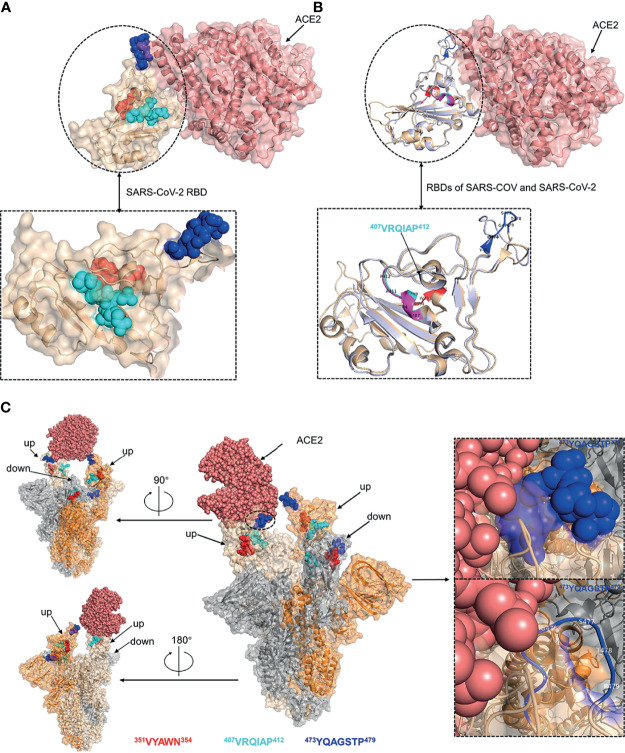
Figure 7.
Structural analysis of the identified linear B-cell epitopes. (A) The linear B-cell epitopes were mapped on the structure of SARS-CoV-2 RBD-ACE2 complex (PDB ID: 6M0J). Inset was a zoomed-in view of the SARS-CoV-2 RBD. (B) The structure of SARS-CoV RBD-ACE2 complex (PDB ID: 2AJF) was superimposed with the structure of SARS-CoV-2 RBD-ACE2 complex (PDB ID: 6M0J). Cartoon representation of the RBDs of SARS-CoV and SARS-CoV-2. Inset was a zoomed-in view of the RBDs of SARS-CoV and SARS-CoV-2. (C) The localization of identified epitopes mapped on SARS-CoV-2 S trimer (PDB ID: 7A95). Two RBDs in the open state and one RBD in the closed state. The S monomer configured ‘up’ and complexed with ACE2 was colored as wheat. The other ‘up’ configured S monomer was colored as orange. The S monomer in the closed state was colored as grey. Insets were zoomed-in views of the localization of epitope 473YQAGSTP479. Throughout the whole figure, SARS-CoV RBD (whiteblue), SARS-CoV-2 RBD (wheat), ACE2 (salmon pink), epitope 407VRQIAP412 on SARS-CoV RBD (magentas), epitope 407VRQIAP412 on SARS-CoV-2 RBD (cyan), epitope 350VYAWN354 (red), epitope 473YQAGSTP479 (blue).

