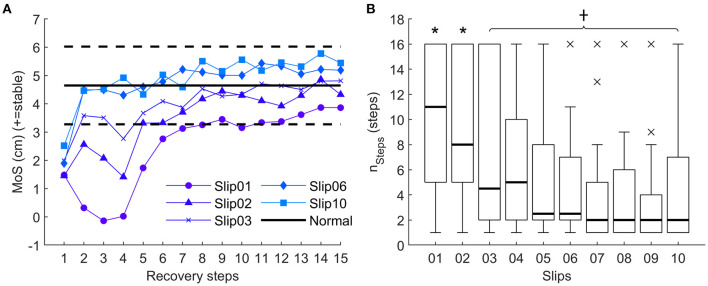
Figure 3.
(A) Average margin of stability for all participants for the 15 recovery steps recorded for Slip01, Slip02, Slip03, Slip06, and Slip10. Solid and dotted horizontal black lines represent Normal ± 1 standard deviation (SD), respectively. See Supplementary Figure 2 for YA and OA curves. (B) Boxplots of nsteps (i.e. first step of at least three consecutive steps back to ± 1 SD of Normal MoS) from Slip01 and Slip10. Thick horizontal black lines: median; thin horizontal black line: first and third quartiles; × : outliers. *: significantly larger than Slip10, p ≤ 0.0011; †: significantly lower than Slip01, p ≤ 0.0011. See Supplementary Figure 3 for participants' data points.

