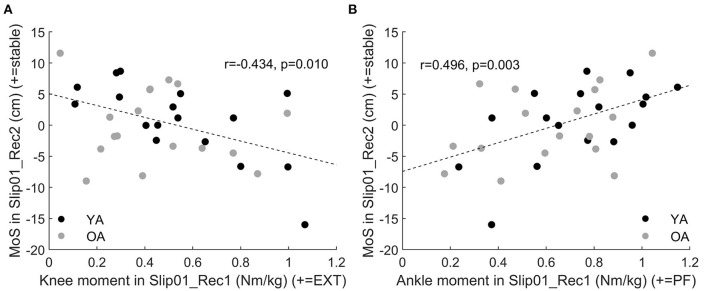
Figure 9.
(A) Correlation between knee moment in Slip01_Rec1 from 23 to 79% stance and the MoS of Slip01_Rec2 (r = −0.434, p = 0.01). (B) Correlation between ankle moment in Slip01_Rec1 from 37 to 90% stance and the MoS of Slip01_Rec2 (r = 0.496, p = 0.003). Black circles: young adults; grey circles: older adults.

