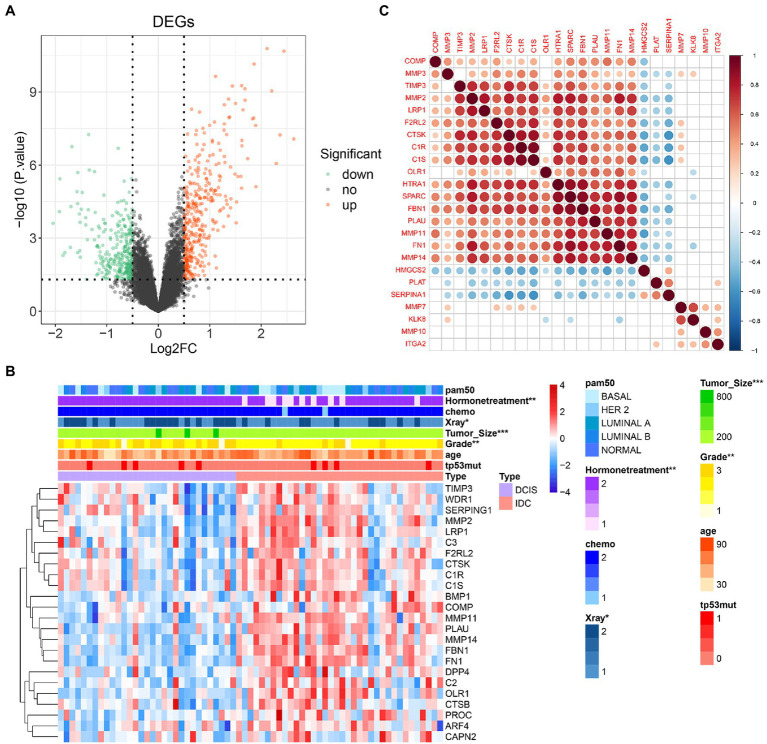
Figure 2.
COAGULATION-related genes expression and correlation analysis. (A) Volcano map reveals the distribution of downregulated and upregulated DECGs. X-axis: fold change; Y-axis: −log10 p-value. (B) Heat map shows the expression of differentially expressed COAGULATION-related genes between DCIS and IDC samples. (C) Pearson correlation of these differentially expressed COAGULATION-related genes. * p < 0.05, ** p < 0.01, and *** p <0.001.

