Figure 5.
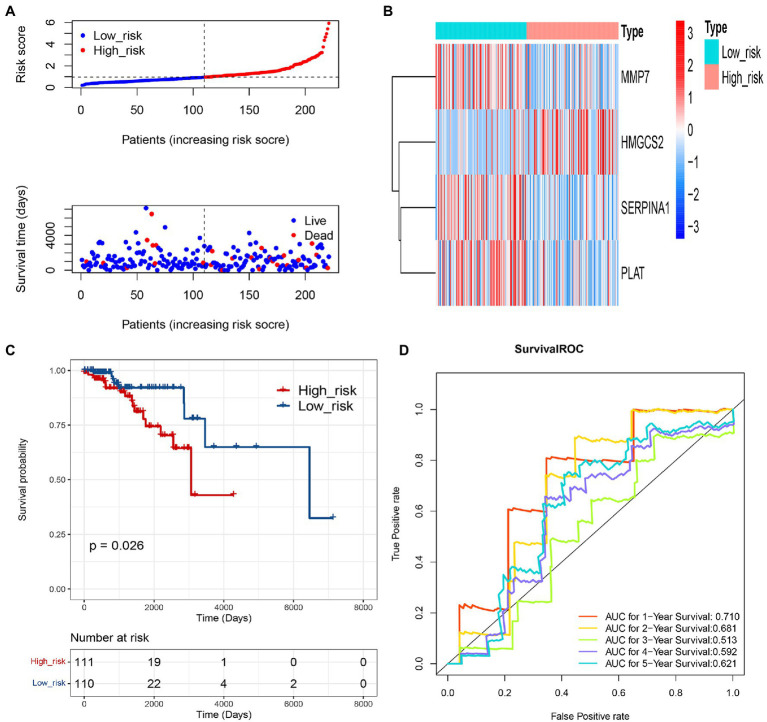
Validation of the prognostic gene signature of 4 COAGULATION-related genes. (A) Risk curve and its corresponding scatter plots in the validation set. (B) Heat map of risk model genes in the validation set. (C) Kaplan–Meier survival curves of high- and low-risk groups in the validation set. Red represents high risk, and blue represents low risk. (D) Survival ROC curves for 1-, 2-, 3-, 4-, and 5-year survival.

