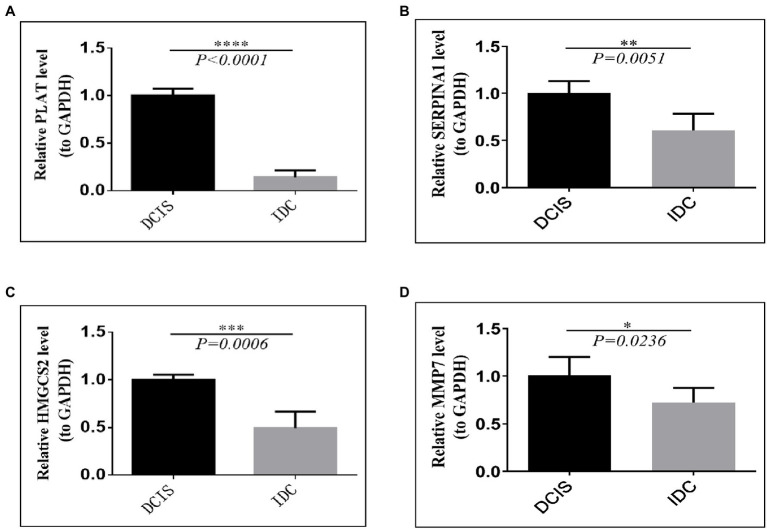
Figure 9.
Validation of prognostic signature gene expression in IDC/DCIS tissues. The mRNA expression patterns of four prognostic between DCIS and IDC tissues. (A) PLAT, (B) SERPINA1, (C) HMGCS2, and (D) MMP7. All experimental data were expressed in means ± SD (IDC: n=10, DCIS: n=5). * p<0.05, ** p<0.01, *** p<0.001, **** vs. the DCIS group.

