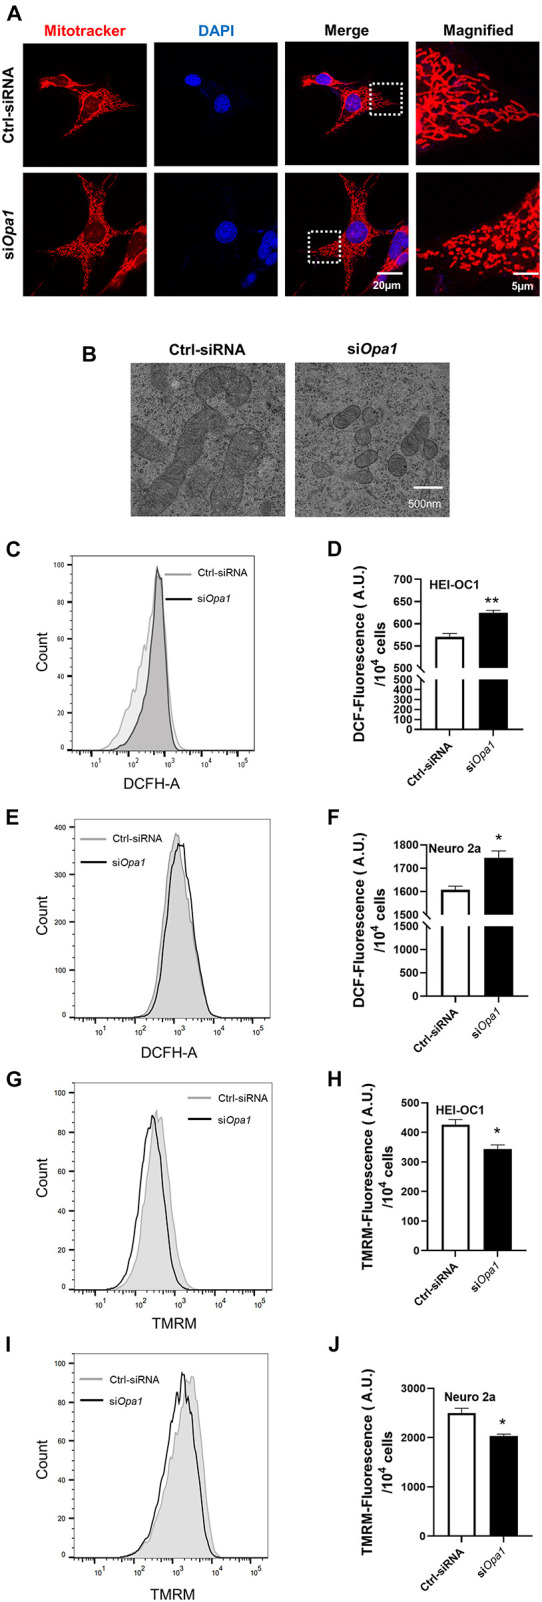
FIGURE 2.

Loss of Opa1 leads to mitochondrial dysfunction in HEI-OC1 and Neuro 2a cells. (A) Representative confocal microscopic images of MitoTracker staining at 24 h after siRNA transfection of HEI-OC1 cells. Right panels show magnified views of the areas marked in the left panels. (B) HEI-OC1 cells were transfected with scramble (Ctrl) siRNA or siOpa1 for 24 h and fixed, and thin sections of cells were visualized by transmission electron microscopy. (C) Intracellular ROS level was measured by flow cytometric analysis using DCFH-DA in HEI-OC1 cells transfected with siRNA for 24 h. (D) Quantitative histograms of the mean fluorescence intensity of DCFH-DA in HEI-OC1 cells. **p < 0.01 (non-parametric Mann-Whitney t-test). (E,F) Representative flow cytometric plot (E) and quantitative histograms (F) of the mean fluorescence intensity of DCFH-DA in Neuro 2a cells transfected with siRNA for 24 h. *p < 0.05 (non-parametric Mann-Whitney t-test). (G) The mitochondrial membrane potential of HEI-OC1 cells was measured by flow cytometric analysis using TMRM fluorescence at 24 h after siRNA transfection. (H) Bar graph shows the relative TMRM mean intensity in HEI-OC1 cells. *p < 0.05 (non-parametric Mann-Whitney t-test). Representative flow cytometric plot (I) and quantitative histograms (J) of the relative TMRM mean intensity in Neuro 2a cells. *p < 0.05 (non-parametric Mann-Whitney t-test).
