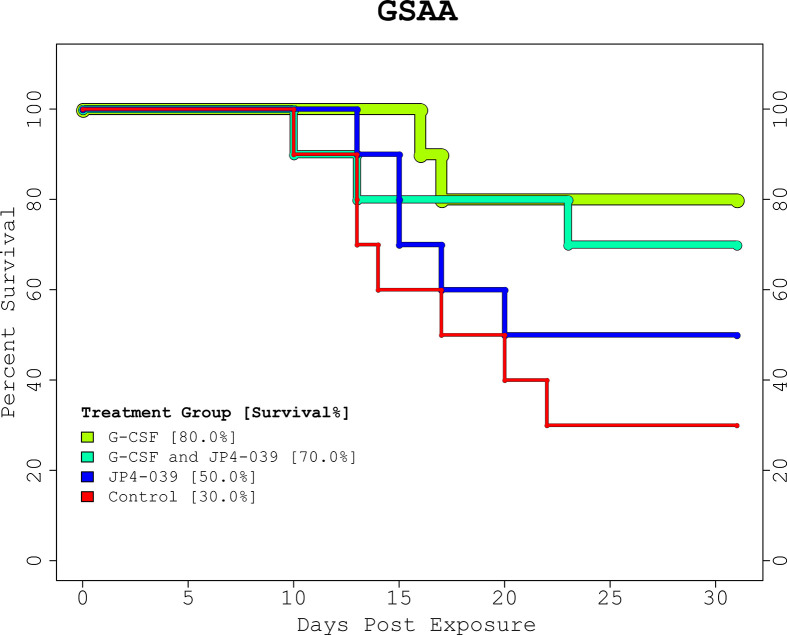
Figure 1.
GSAA Experiment Kaplan-Meier Plot. The KM plot for the 2 drug GSAA experiment demonstrates the survival rate of the 4 treatment combinations. Day 0 and 1 are baseline and post-irradiation, respectively. Note the first necessary sacrifice occurs after day 9, and survivors past day 24 were assumed to have recovered from the TBI. Neither treatment nor control, guaranteed full survival or recovery. The treatment groups receiving G-CSF outperformed those with JP4-039 or control. The JP4-039 treatment was not statistically significantly different from the control with a p-value = 0.346.

