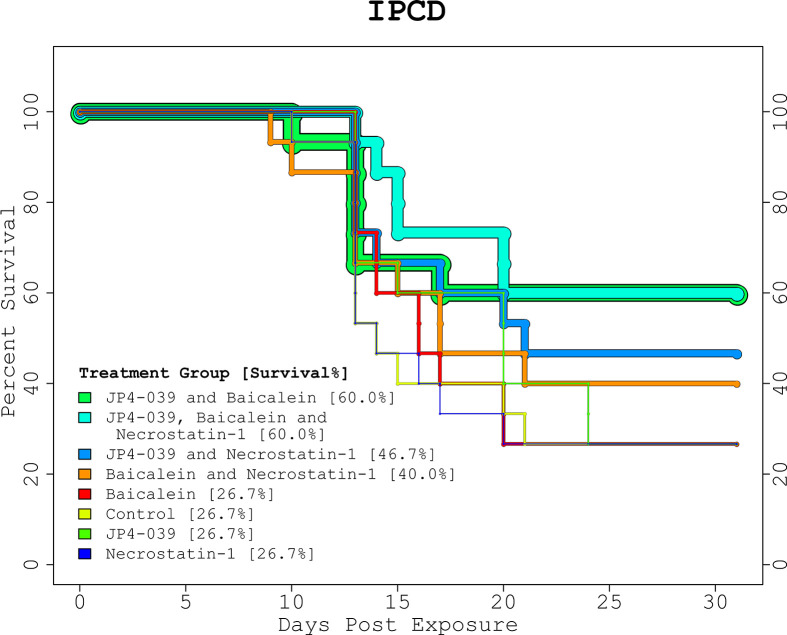
Figure 2.
IPCD Experiment Kaplan-Meier Plot. The KM plot for the 3 drug IPCD experiment illustrates the survival rates of the 8 treatment combinations. Day 0 and 1 are baseline and post-irradiation, respectively. The critical period between days 9 to 24, when any mice requiring euthanasia were sacrificed, match the time period in the GSAA experiment. The single drug treatments performed as well as the control with a 26.67% survival rate. The top performing combinations included both JP4-039 and baicalein. With and without necrostatin-1 (p-value = 0.0359, and p-value = 0.0995, respectively), these treatment groups were statistically significantly different from the control, with survival rates of 60% versus 26.7%.

