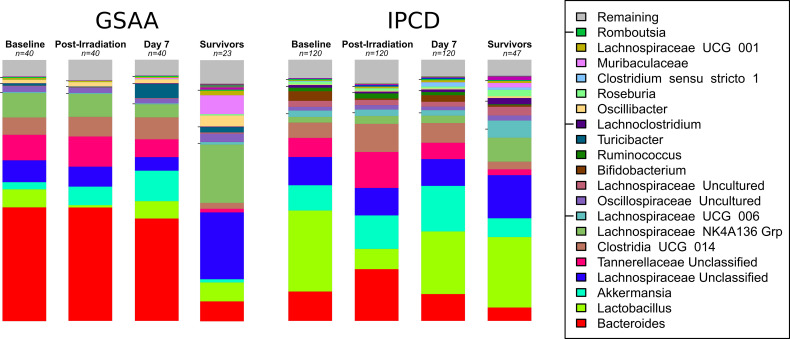
Figure 3.
Stacked Bar Chart of Microbiota at Key Time Points. The stacked bar charts represent the average relative abundance at each time point of the top taxa between both experiments. Experiment GSAA and IPCD (left and right, respectively), each have 4 time points depicted: Baseline (Day 0), Post-Irradiation (Day 1), Post-treatment but before any sacrifices (Day 7), and Survivors (Day 30). The taxa are ordered by decreasing average abundance across all samples from bottom (Bacteroides) to the top (Remaining). Taxa in the Remaining category represent multiple taxa with abundances too low to individually represent visually. The baseline, post-irradiation, and day 7 consist of n = 40 and n = 120 samples, for the GSAA and IPCD experiments, respectively. The stacked bar chart for the survivors only consisted of the n = 23 and n = 47 samples from the GSAA and IPCD experiments, respectively, so survivor bias will be present here. From these charts, the difference in the baseline, i.e. batch specific differences, and their response to TBI can be qualitatively observed. Lactobacillus can be clearly seen to decrease in the post-irradiation samples, then recover by day 7. The taxonomic composition of the survivors have not returned to baseline.

