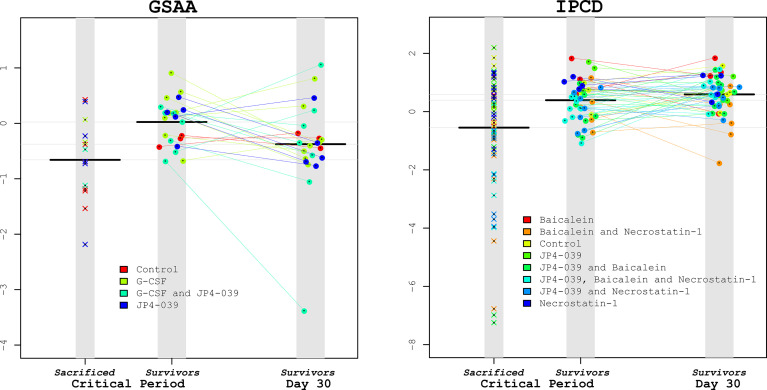
Figure 6.
Lactobacillus levels comparing Sacrificed vs. Survivors. To visually illustrate the results from the survival analysis, Lactobacillus levels during the critical period were compared between the sacrificed vs. the surviving mice for the GSAA and IPCD experiments (left and right plots, respectively). Within each plot there are 3 columns: The left-most columns depict the average Lactobacillus levels from the samples available for the mice during the critical period that were eventually sacrificed. The center column depicts the Lactobacillus levels during the critical period for eventual surviving mice, connected with lines to the Lactobacillus levels on day 30 in the right-most column. The black horizontal bars represent the median Lactobacillus levels for each column. From these plots it can be confirmed that the median Lactobacillus levels of the sacrificed mice were lower than the survivors during the critical period for both experiments. The Lactobacillus levels of the eventual survivors were not significantly different between this critical period and at Day 30. These scatter plots illustrate the wide variance of the Lactobacillus levels in the sacrificed mice, suggesting that an intervention of supplemental Lactobacillus by itself may have limited benefits.

