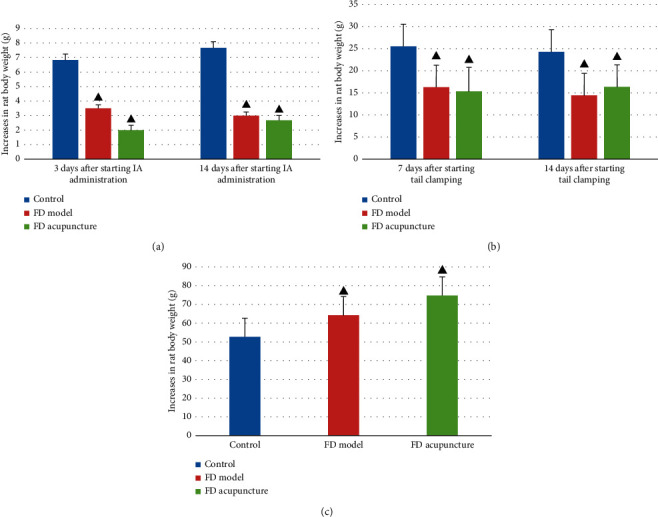
Figure 5.

Increases in rat body weight in different groups. (a) During phase-one oral gavage administration; (b) during phase-two tail clamping; (c) during EA intervention. Data are presented as mean ± SD (n = 6). Note: ▲P < 0.05, versus control group.
