Figure 4.
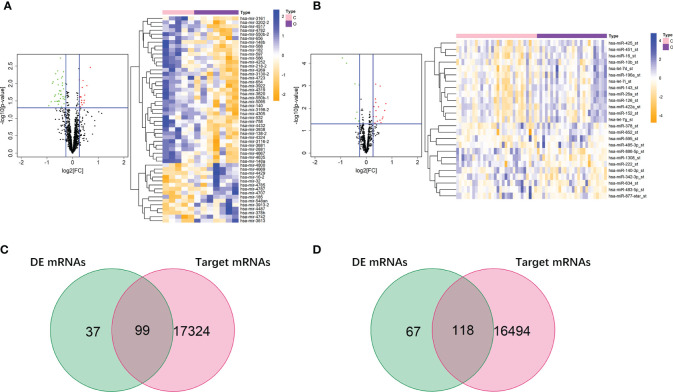
DE miRNAs of obesity in VAT and SAT. 52 DE miRNAs of obesity were screened out in VAT (A), and 25 were screened out in SAT (B). The red points in the volcano plots represent upregulation and the green plots represent downregulation. The color in heatmaps from blue to yellow shows the progression from low expression to high expression. Venn diagrams (C, D) shows that the intersections of DE mRNAs of obesity and predicted target mRNAs in miRNA-mRNA pairs were 99 and 118 for VAT (C) and SAT (D), respectively.

