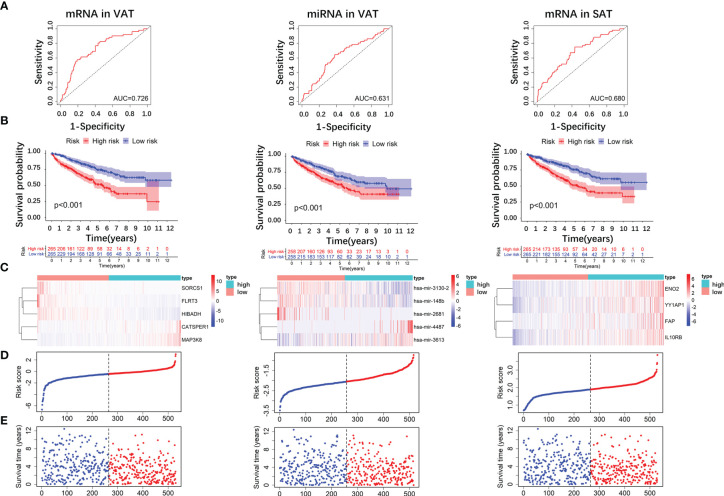
Figure 7.
Risk score analyses of DE RNAs of obesity-related ccRCC in the prognosis of ccRCC. 5 DE mRNAs (SORCS1, FLRT3, HIBADH, CATSPER1, and MAP3K8), 5 DE miRNAs (hsa-miR-3130-2, hsa-miR-148b, hsa-miR-2681, hsa-miR-4487, and hsa-miR-3613) of obesity-related ccRCC in VAT, and 4 mRNAs (ENO2, YY1AP1, FAP, IL10RB) in SAT were used to calculate risk scores. AUC of risk score of mRNAs in VAT was larger than those of miRNAs in VAT, and mRNAs in SAT (A). Overall survival time of patients in the low‐risk group was significantly longer than in the high‐risk group regardless of risk score models (B). Distributions of RNA expressions, risk scores, and survival statuses for each patient were also shown (C–E).

