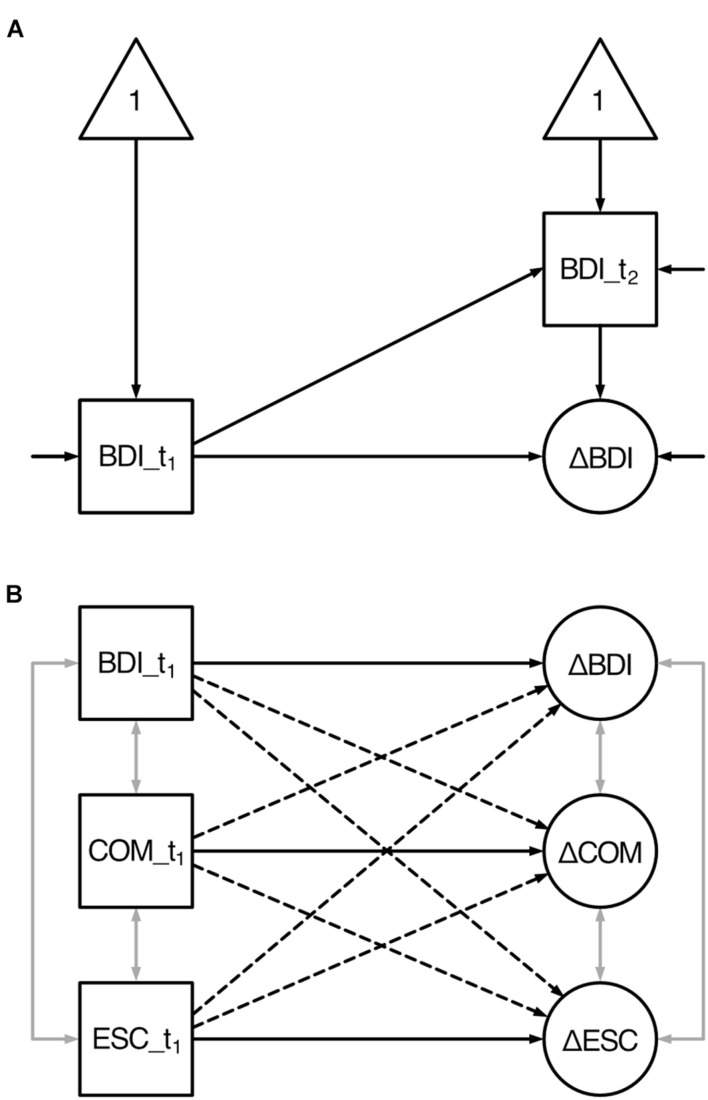
FIGURE 1.
Latent change score model of the hypothesized longitudinal effects between all variables’ baseline and change scores. BDI, depressive symptoms; COM, cognitive motivation; ESC, effortful self-control. t1 denotes to the first assessment (baseline); t2 denotes to the second assessment; Δ denotes to the latent change score. Squares indicate observed variables; ellipses indicate latent variables; triangles indicate constants (intercepts). One-sided arrows indicate directed effects (regression coefficients) except for those without origin (variances), two-sided gray arrows indicate undirected relationships (covariances). (A) Univariate latent change score model exemplified by depressive symptoms. Depressive symptoms are assessed at two time points (BDI_t1 and BDI_t2). The change (ΔBDI) between the two assessments is modeled as latent variable. (B) Simplified model (without t2 observed variables, intercepts, and variances) illustrating the longitudinal effects: The change score of each variable is predicted by its corresponding baseline scores (i.e., self-feedback indicated by solid lines) as well as the baseline scores of the two remaining variables (i.e., cross-domain coupling indicated by dashed lines).

