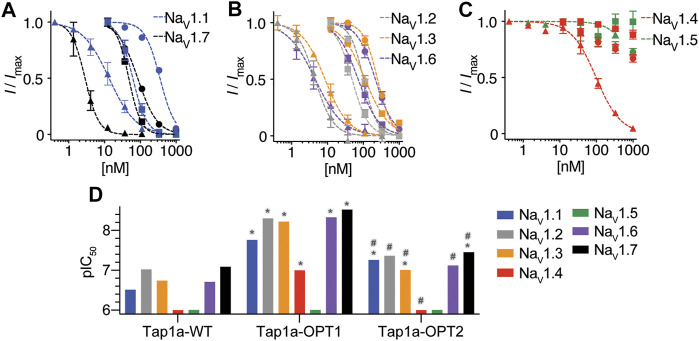
FIGURE 3.
NaV channel subtypes pharmacological profile of Tap1a-WT, Tap1a-OPT1 and Tap1a-OPT2 determined using automated electrophysiology. (A–C) Representative concentration-responses for the inhibition of the hNaV1.1 to hNaV1.7 channels in the presence of increasing concentrations of Tap1a-WT (circles), Tap1a-OPT1 (triangles) and Tap1a-OPT2 (squares) measured by automated whole-cell patch clamp in QPatch 16X. Holding potential was –80 mV and Na+ currents were elicited by 20 ms voltage step to 0 mV from a –120 mV conditioning pulse applied for 200 ms. The IC50 values calculated are described in Table 2 (D) Comparison of the pIC50 values for Tap1a-WT, Tap1a-OPT1 and Tap1a-OPT2 tested against hNaV1.1 to hNaV1.7 and calculated from the dose responses produced in (A–C). *Statistically significant compared to Tap1a-WT; #Statistically significant compared to Tap1a-OPT1; Individual p values are described in the text.

