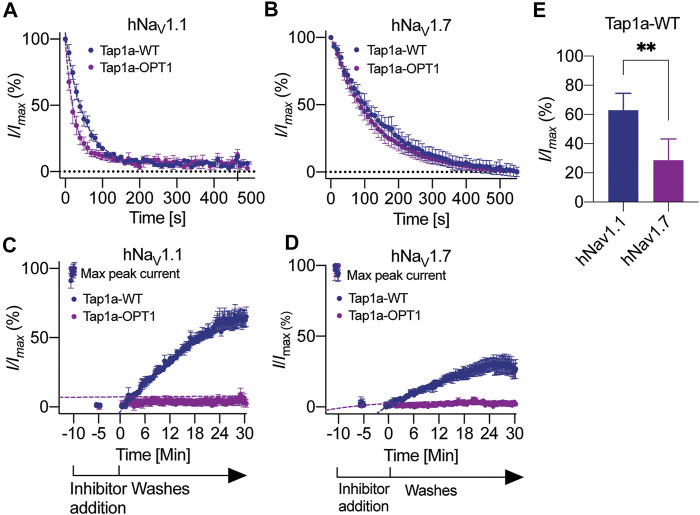
FIGURE 4.
Kinetics of NaV1.1 and NaV1.7 inhibition by Tap1a-WT and Tap1a-OPT1. (A, B) On-rate measurements for Tap1a-WT and Tap1a-OPT1 over NaV1.1 (A) and NaV1.7 (B) were calculated from fitted exponentials of experiments recorded before and after addition of peptides at 10x IC50 concentration. (C, D) Off-rate measurements of Tap1a-WT and Tap1a-OPT1 over NaV1.1 and NaV1.7 were calculated from the fitted exponentials of experiments recorded before and after addition of peptides at 10x IC50 concentration followed by washes with extracellular solution. (E) NaV currents measured at the end of 30 min for NaV1.l and 25 min for NaV1.7 ligand wash-out period. **p = 0.0042. Statistical significance was determined by t-student test. All data points are mean ± SEM of 4–7 independent experiments.

