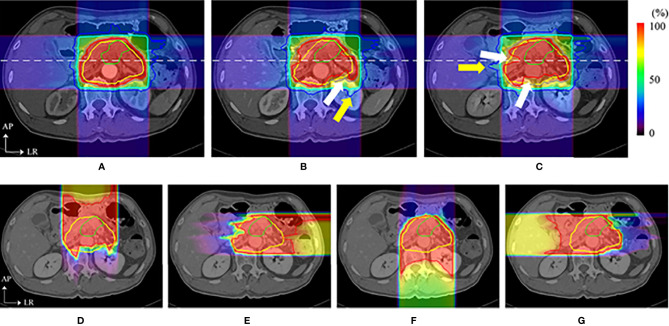
Figure 5.
Dose distributions of a carbon ion RT in axial sections. The top images show the dose distribution of planning CT (A), the dose distribution with a delay time of (B) 35 s (intra-CT), and (C) 145 s (intra-CT), respectively. Beam overshoot (yellow arrows) and undershoot (white arrows) were observed at scan intervals of 35 and 145 s. The bottom images show the dose distributions of (D) 0°, (E) 90°, (F) 180°, and (G) 270° at 145 s. The green and yellow lines show the shapes of the gross tumor volume and the clinical target volume, respectively. The rainbow contours show the dose distribution (35) (Source: Elsevier. Used with permission).

