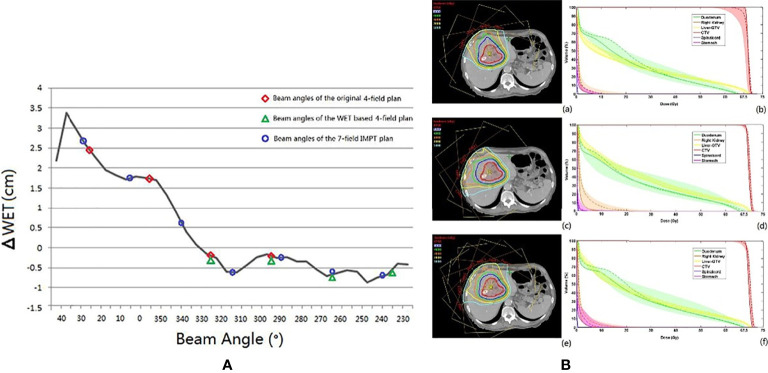
Figure 6.
(A) The black line is the ΔWET (the difference of water equivalent thickness between the planning CT and the CT-on-rail) curve. The beam angles of the original IMPT plan (25°, 355°, 325°, and 295°), the WET-based four fields plan (325°, 295°, 265°, and 235), and the revised seven fields plan (30°, 5°,340°, 315°, 290°, 265°, and 240°) are indicated with the red circle, the green triangle, and the blue circle, respectively. (B) The axial view of the same planar doses and fields for (a) the original IMPT plan, (c) the IMPT plan with beam angles of the minimum values of ΔWET, and (e) the seven-field IMPT plan. The dose–volume histograms of the planned dose (solid line), the accumulated dose (dashed line), and the bands for all fractional doses of (b) the original IMPT plan, (d) the IMPT plan with beam angles of the minimum values of ΔWET, and (f) the seven-field IMPT plan (49) (Source: Elsevier. Used with permission).

