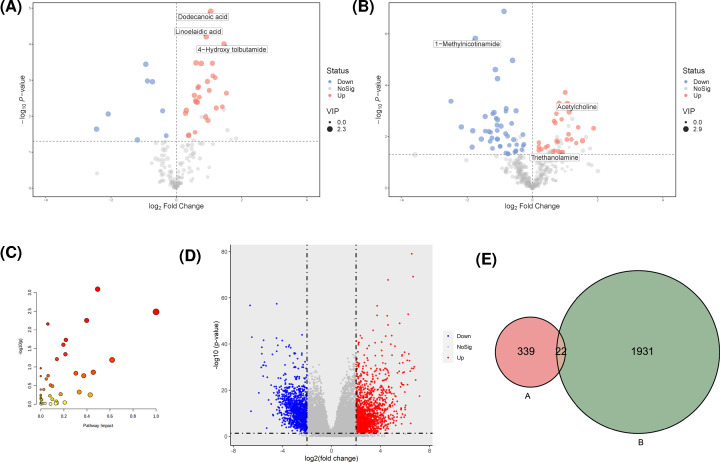
Figure 2. Integration analysis of metabolomics and transcriptomics data.
(A) Volcano plots derived from negative ion mode of GC patients. (B) Volcano plot derived from positive ion mode of GC patients. The red and blue points represented up-regulated and down-regulated genes, respectively. (C) Bubble analysis of metabolic pathways between GC and PC groups. Ordinate showed the significance and abscissa represented the impact of pathway. (D) Volcano plot of DEGs from TCGA. The red and blue points represented up-regulated and down-regulated genes, respectively. (E) Venn diagram of metabolic pathways related genes and DEGs. (A) represented genes related with metabolites and (B) indicated DEGs obtained from TCGA.

