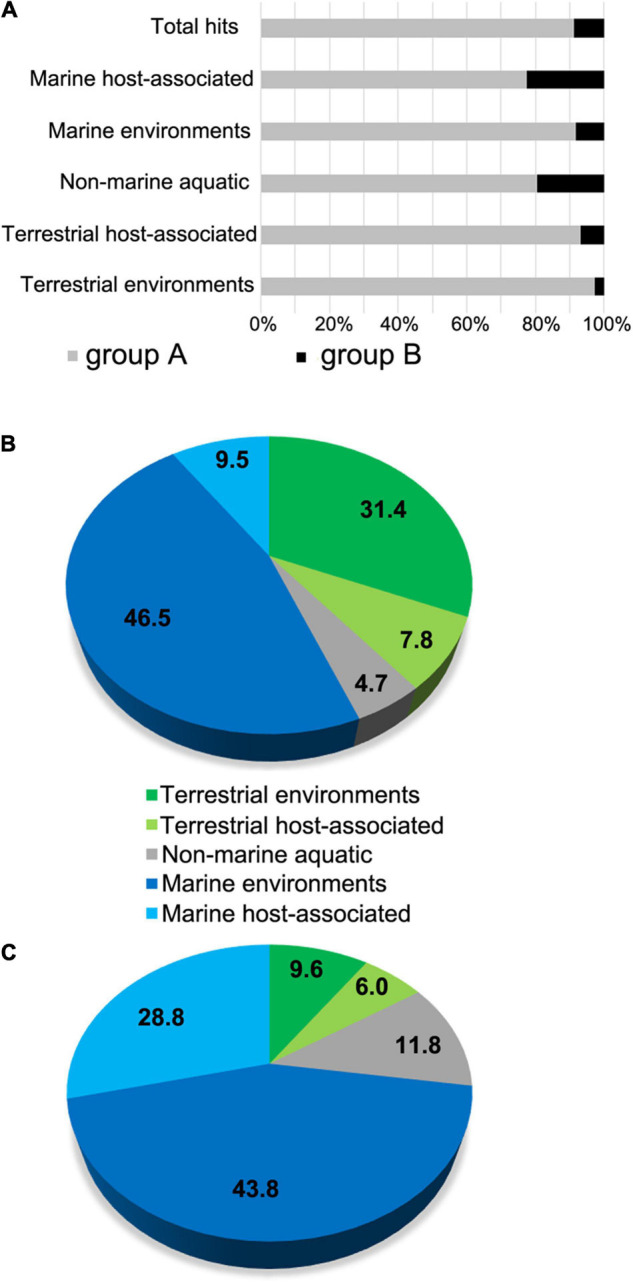
FIGURE 4.

Analysis of environmental distributions of L-2-HAD homologs into IMG/MER metagenome database. (A) Global abundance representation of the DehIVa homologs (group A) and ZgHAD homologs (group B) among L-2-HADs hit number in the full set of IMG/MER metagenomes. (B,C) Distributions of the group A hits (B) and the group B hits (C) sequence hits among five IMG/MER ecosystem subsets.
