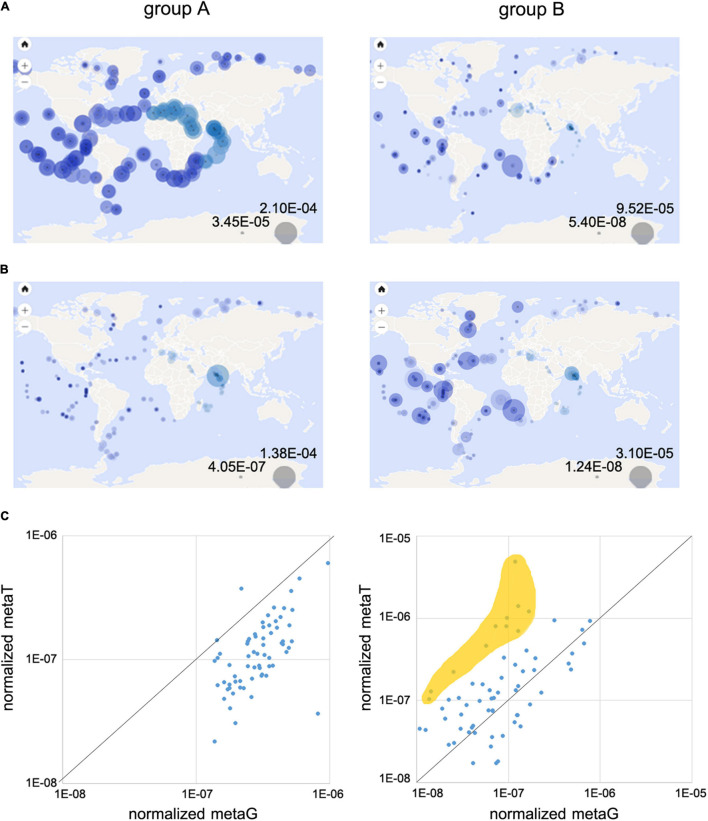
FIGURE 5.
Analysis of oceanic distribution of L-2-HADs into OGA databases. Geographic distribution of relative abundances of group A and group B homologs into metagenomic (A) and metatranscriptomic (B) OGA databases. Global abundance scales are represented by the two gray circles at the bottom right of the maps. (C) Scatterplots of the normalized gene abundance (normalized metaG) vs. normalized transcript abundance (normalized metaT) for each sampling station.

