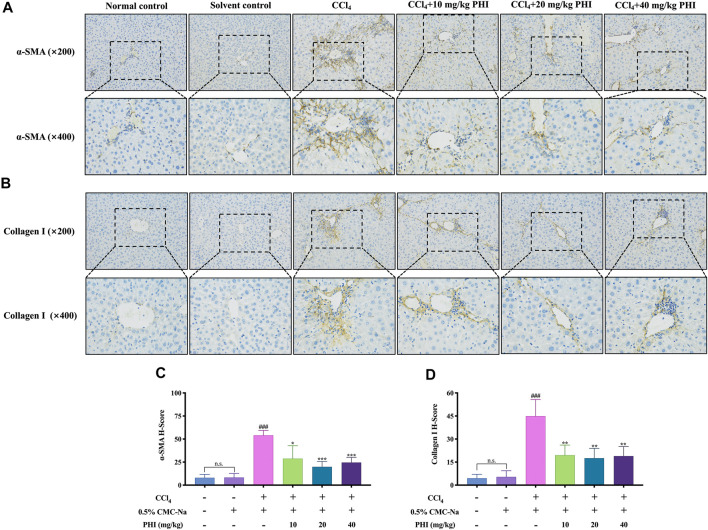
FIGURE 4.
Effect of PHI on the expression of α-SMA and collagen I. (A) Immunohistochemistry staining of α-SMA in the liver tissues ( × 200 and × 400). (B) Immunohistochemistry staining of collagen I in the liver tissues ( × 200 and × 400). (C) Quantitative results of α-SMA in the liver tissues (D) Quantitative results of collagen I in the liver tissues. Data was expressed as the mean ± SD (n = 6). ### p < 0.001 represent compared with solvent control group. *p < 0.05, **p < 0.01, ***p < 0.001 represent compared with CCl4 group. n. s indicates no significant.

