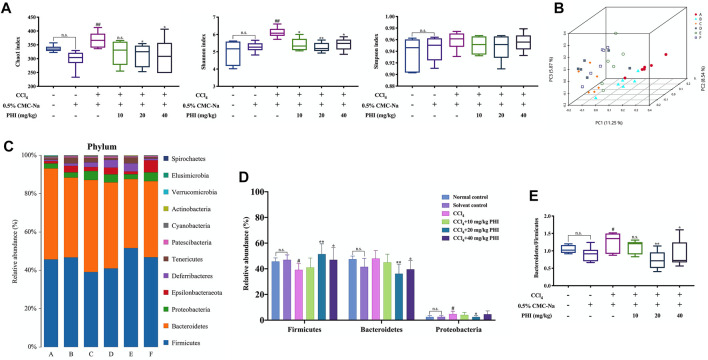
FIGURE 7.
PHI modulates the composition of gut microbiota. (A) The alpha diversity of each group was obtained using the Chao1 index, Shannon index and Simpson index. (B) PCoA of gut microbiota. (C) The relative abundance of bacteria at the phylum level. (D) Representative histogram of the gut microbiota at the phylum level. (E) Bacteroides to Firmicutes ratio. A: Normal control; B: Solvent control; C: CCl4; D: CCl4 + 10 mg/kg PHI; E: CCl4 + 20 mg/ kg PHI; F: CCl4 + 40 mg/ kg PHI. Data was expressed as the mean ± SD (n = 6). # p < 0.05, ## p < 0.01 represent compared with solvent control group. *p < 0.05, **p < 0.01 represent compared with CCl4 group. n. s indicates no significant.

