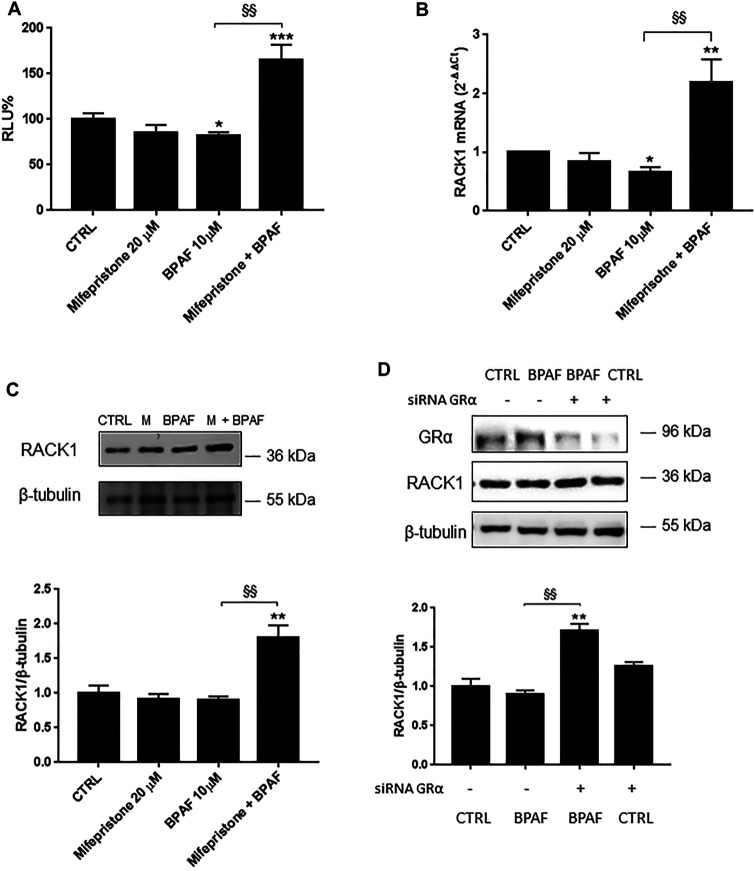
FIGURE 4.
Role of GRα in BPAF-induced RACK1 regulation. (A) THP-1 cells transiently transfected with the Δ1 construct were pre-treated for 30 min with 20 μM mifepristone, then with 10 μM BPAF for 16 h or DMSO as vehicle control (CTRL). Cells were lysed and luciferase activity was measured as described in “Materials and Methods” section. Luciferase activities are expressed as RLU% respected to non-treated construct (considered as 100%). Results are expressed as mean ± SEM, n = 3 independent experiments performed in triplicate. Statistical analysis was performed with Tukey’s multiple comparison test with *p < 0.05, ***p < 0.001 vs. control (CTRL) and §§ p < 0.01 vs. BPAF 10 μM. (B–C) THP-1 cells pre-treated for 30 min with 20 μM mifepristone were treated for 18 h (B) or 24 h (C) with 10 μM BPAF or DMSO as vehicle control (CTRL). (B) mRNA levels evaluated by qPCR (endogenous reference, 18S). (C) The image is a representative Western blot. RACK1 protein levels evaluated by Western blotting, normalized to β-tubulin expression. Each value represents the mean ± SEM, n = 3 independent experiments. Statistical analysis was performed with Tukey’s multiple comparison test with *p < 0.05, **p < 0.01 vs control (CTRL) and §§ p < 0.01 vs BPAF 10 μM. (D) THP-1 cells silenced for 48 h with GRα-directed siRNA were treated for 24 h with 10 μM BPAF or DMSO as vehicle control (CTRL). The image is a representative Western blot. RACK1 and GRα protein levels evaluated by Western blotting, normalized to β-tubulin expression. Statistical analysis was performed with Tukey’s multiple comparison test with **p < 0.01 vs control (CTRL) and §§ p < 0.01 vs. BPAF-treated nonsilenced cells.

