FIGURE 6.
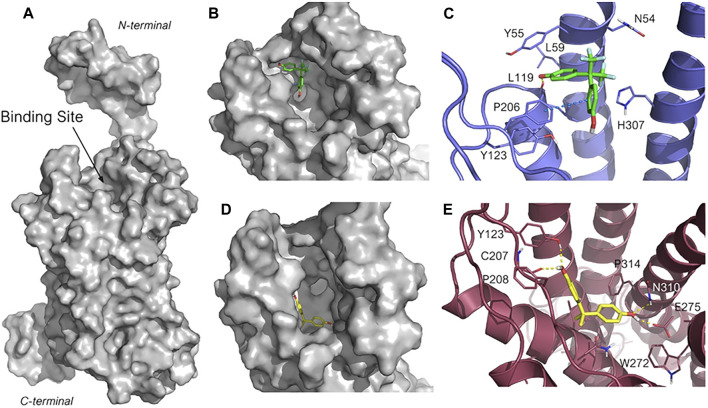
Predicted binding mode for BPAF and BPA in GPER ligand binding site. (A) Structure of GPER obtained through homology modeling by using the web server GPCR-I-TASSER (HG ID: HG0714). The putative binding site is indicated. (B, C) Close-up of the binding site highlighting the different sub-pockets occupied by BPAF (B, in green sticks carbons) and BPA (D, in yellow sticks carbon). (D, E) Highest ranked pose for BPAF (D, in green stick carbons) and BPA (E, in orange sticks carbons) within the GPER binding site. The 3D structure of GPER is represented in blue cartoon (D) and warmpink cartoon (E), and the key amino acid residues interacting with the ligand are represented in lines. The heteroatoms are color-coded: oxygen in red, nitrogen in blue, sulfur in yellow and fluorine in pale green. The H-bonding and the π–π stacking are represented in yellow, and blue dotted lines, respectively.

