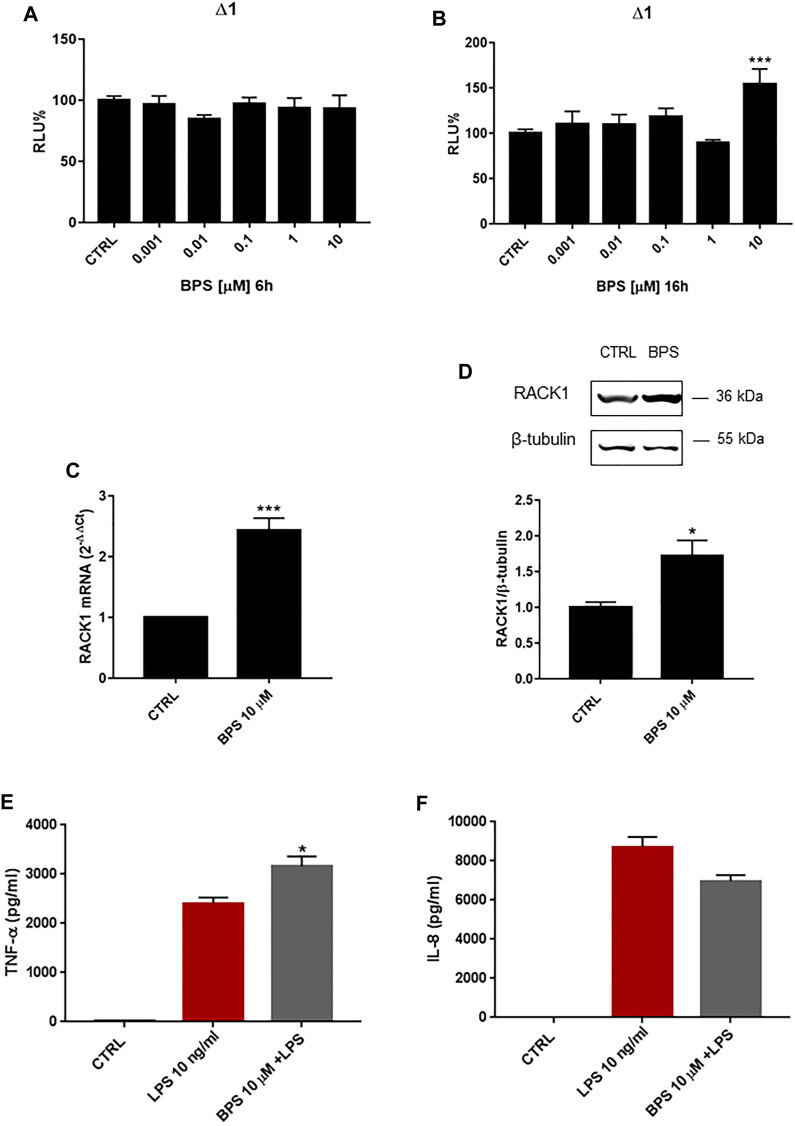
FIGURE 7.
Effects of BPS on RACK1 expression and immune activation. (A–B) THP-1 cells transiently transfected with the Δ1 construct were treated for 6 h (A) or 16 h (B) with increasing concentrations of BPS (0.001–10 μM) or DMSO as vehicle control (CTRL). Cells were lysed and luciferase activity was measured as described in “Materials and Methods” section. Luciferase activities are expressed as RLU% respected to non-treated construct (considered as 100%). Results are expressed as mean ± SEM, n = 3 independent experiments performed in quadruplicate. Statistical analysis was performed with Dunnett’s multiple comparison test with ***p < 0.001 vs. control (CTRL). (C–D) THP-1 cells treated for 18 h (C) or 24 h (D) with 10 μM BPS or DMSO as vehicle control (CTRL). (C) mRNA levels evaluated by qPCR (endogenous reference, 18S). (D) The image is a representative Western blot. RACK1 protein levels evaluated by Western blotting, normalized to β-tubulin expression. Each value represents the mean ± SEM n = 3 independent experiments. Significance was set at p < 0.05 by the Student’s t-test (*p < 0.05, ***p < 0.01). (E–F) THP-1 cells treated with 10 ng/ml LPS without and with 10 μM BPS or DMSO as vehicle control (CTRL). Secretion of cytokines TNF-α (E) and IL-8 (F) evaluated by sandwich ELISAs. Statistical analysis was performed with Student’s t-test with *p < 0.05 vs LPS alone.

