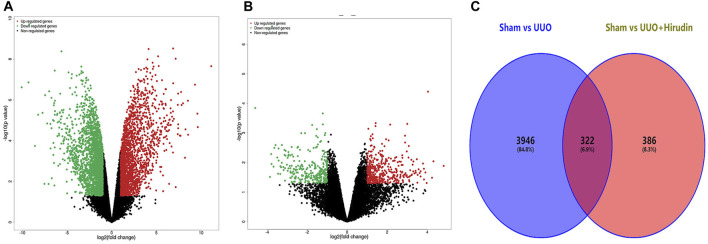
FIGURE 3.
Transcriptomic assay and bioinformatics analysis. (A) Compared Sham group with UUO group, filtering of DEGs was presented by volcano. (B) Compared UUO hirudin-treated group with UUO group, filtering of DEGs was presented by volcano. (C) Venn diagram of overlapping genes derived from transcriptome analysis in a pairwise comparison. Red color represents upregulated genes, while green color shows downregulated genes.

