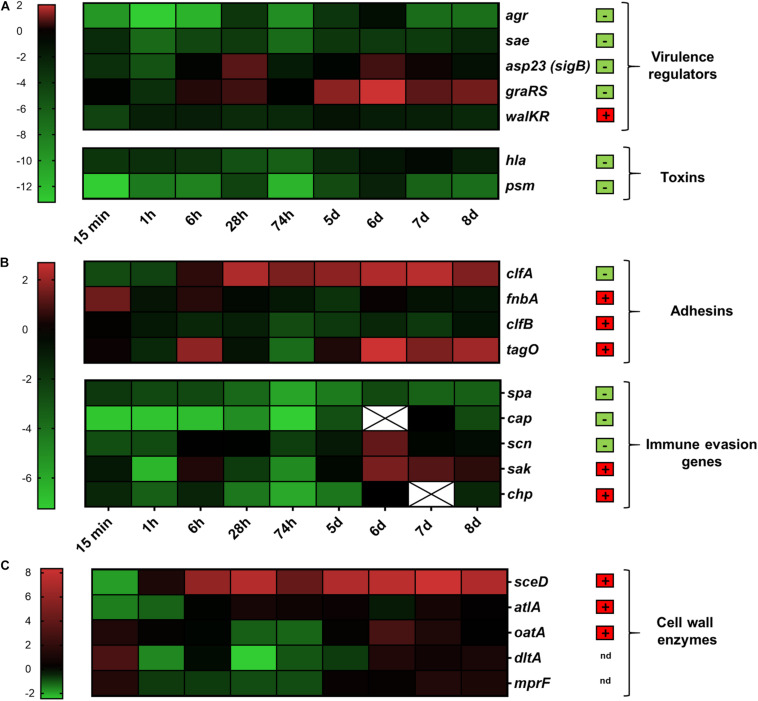
FIGURE 3.
Transcriptional analysis during human skin colonization. Results are depicted as the ratio of transcription ex vivo vs. maximal expression in vitro. All data were log transformed (basis 2) and changes in gene expression were normalized in reference to the constitutively expressed gene gyrB. Genes colored red were up-regulated compared to in vitro; genes colored green were down-regulated compared to in vitro. Black indicates the same expression levels ex vivo and in vitro. White cells with an “x” have no values because gene expression was below the detection limit. Results are the mean values of 3 different skin samples from different individuals. (A) Genes belonging to virulence regulation and toxin production were clustered. (B) Genes involved in adhesion and immune evasion were combined. (C) Genes involved in cell wall modification. Genes relevant during nasal colonization were marked with a + (box with red background), while genes that were not relevant during nasal colonization were marked with a – (box with green background) (Burian et al., 2010b). Gene name abbreviations see Supplementary Table 2. The color chart was generated using GraphPad Prism 9.0.2.

