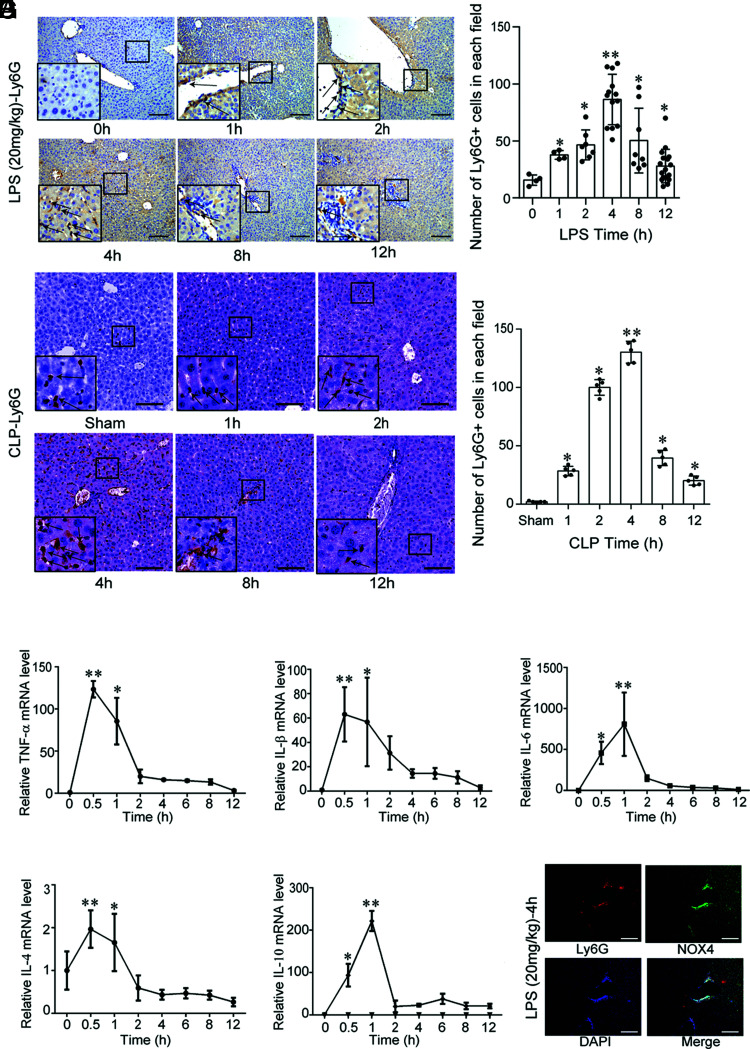
FIGURE 1.
Both LPS and CLP induce early recruitment of neutrophils to the liver. (A) Ly-6G expression in the liver after the i.p. injection of LPS (20 mg/kg) into wild-type C57BL/6 mice (n = 6 per group) or CLP (n = 5 per group) at different time points (0, 1, 2, 4, 8, and 12 h). Scale bar, 100 μm. *p < 0.05 versus the control (or sham) group, **p < 0.01 versus the 0-h (or sham) group. (B–F) TNF-α, IL-1β, IL-6, IL-4, and IL-10 mRNA levels (mean ± SD) in the liver after LPS (20 mg/kg) injection into wild-type C57BL/6 mice (n = 6 per group) at different time points (0, 0.5, 1, 2, 4, 6, 8, and 12 h). *p < 0.05 versus the 0-h group, **p < 0.01 versus the 0-h group. (G) Ly-6G and NOX4 colocalization in the liver after the i.p. injection of LPS (20 mg/kg) into wild-type C57BL/6 mice at 4 h. Scale bar, 100 μm.

